

Several of these need a paid plan. Plans & access lists what’s free.
Records open as cards
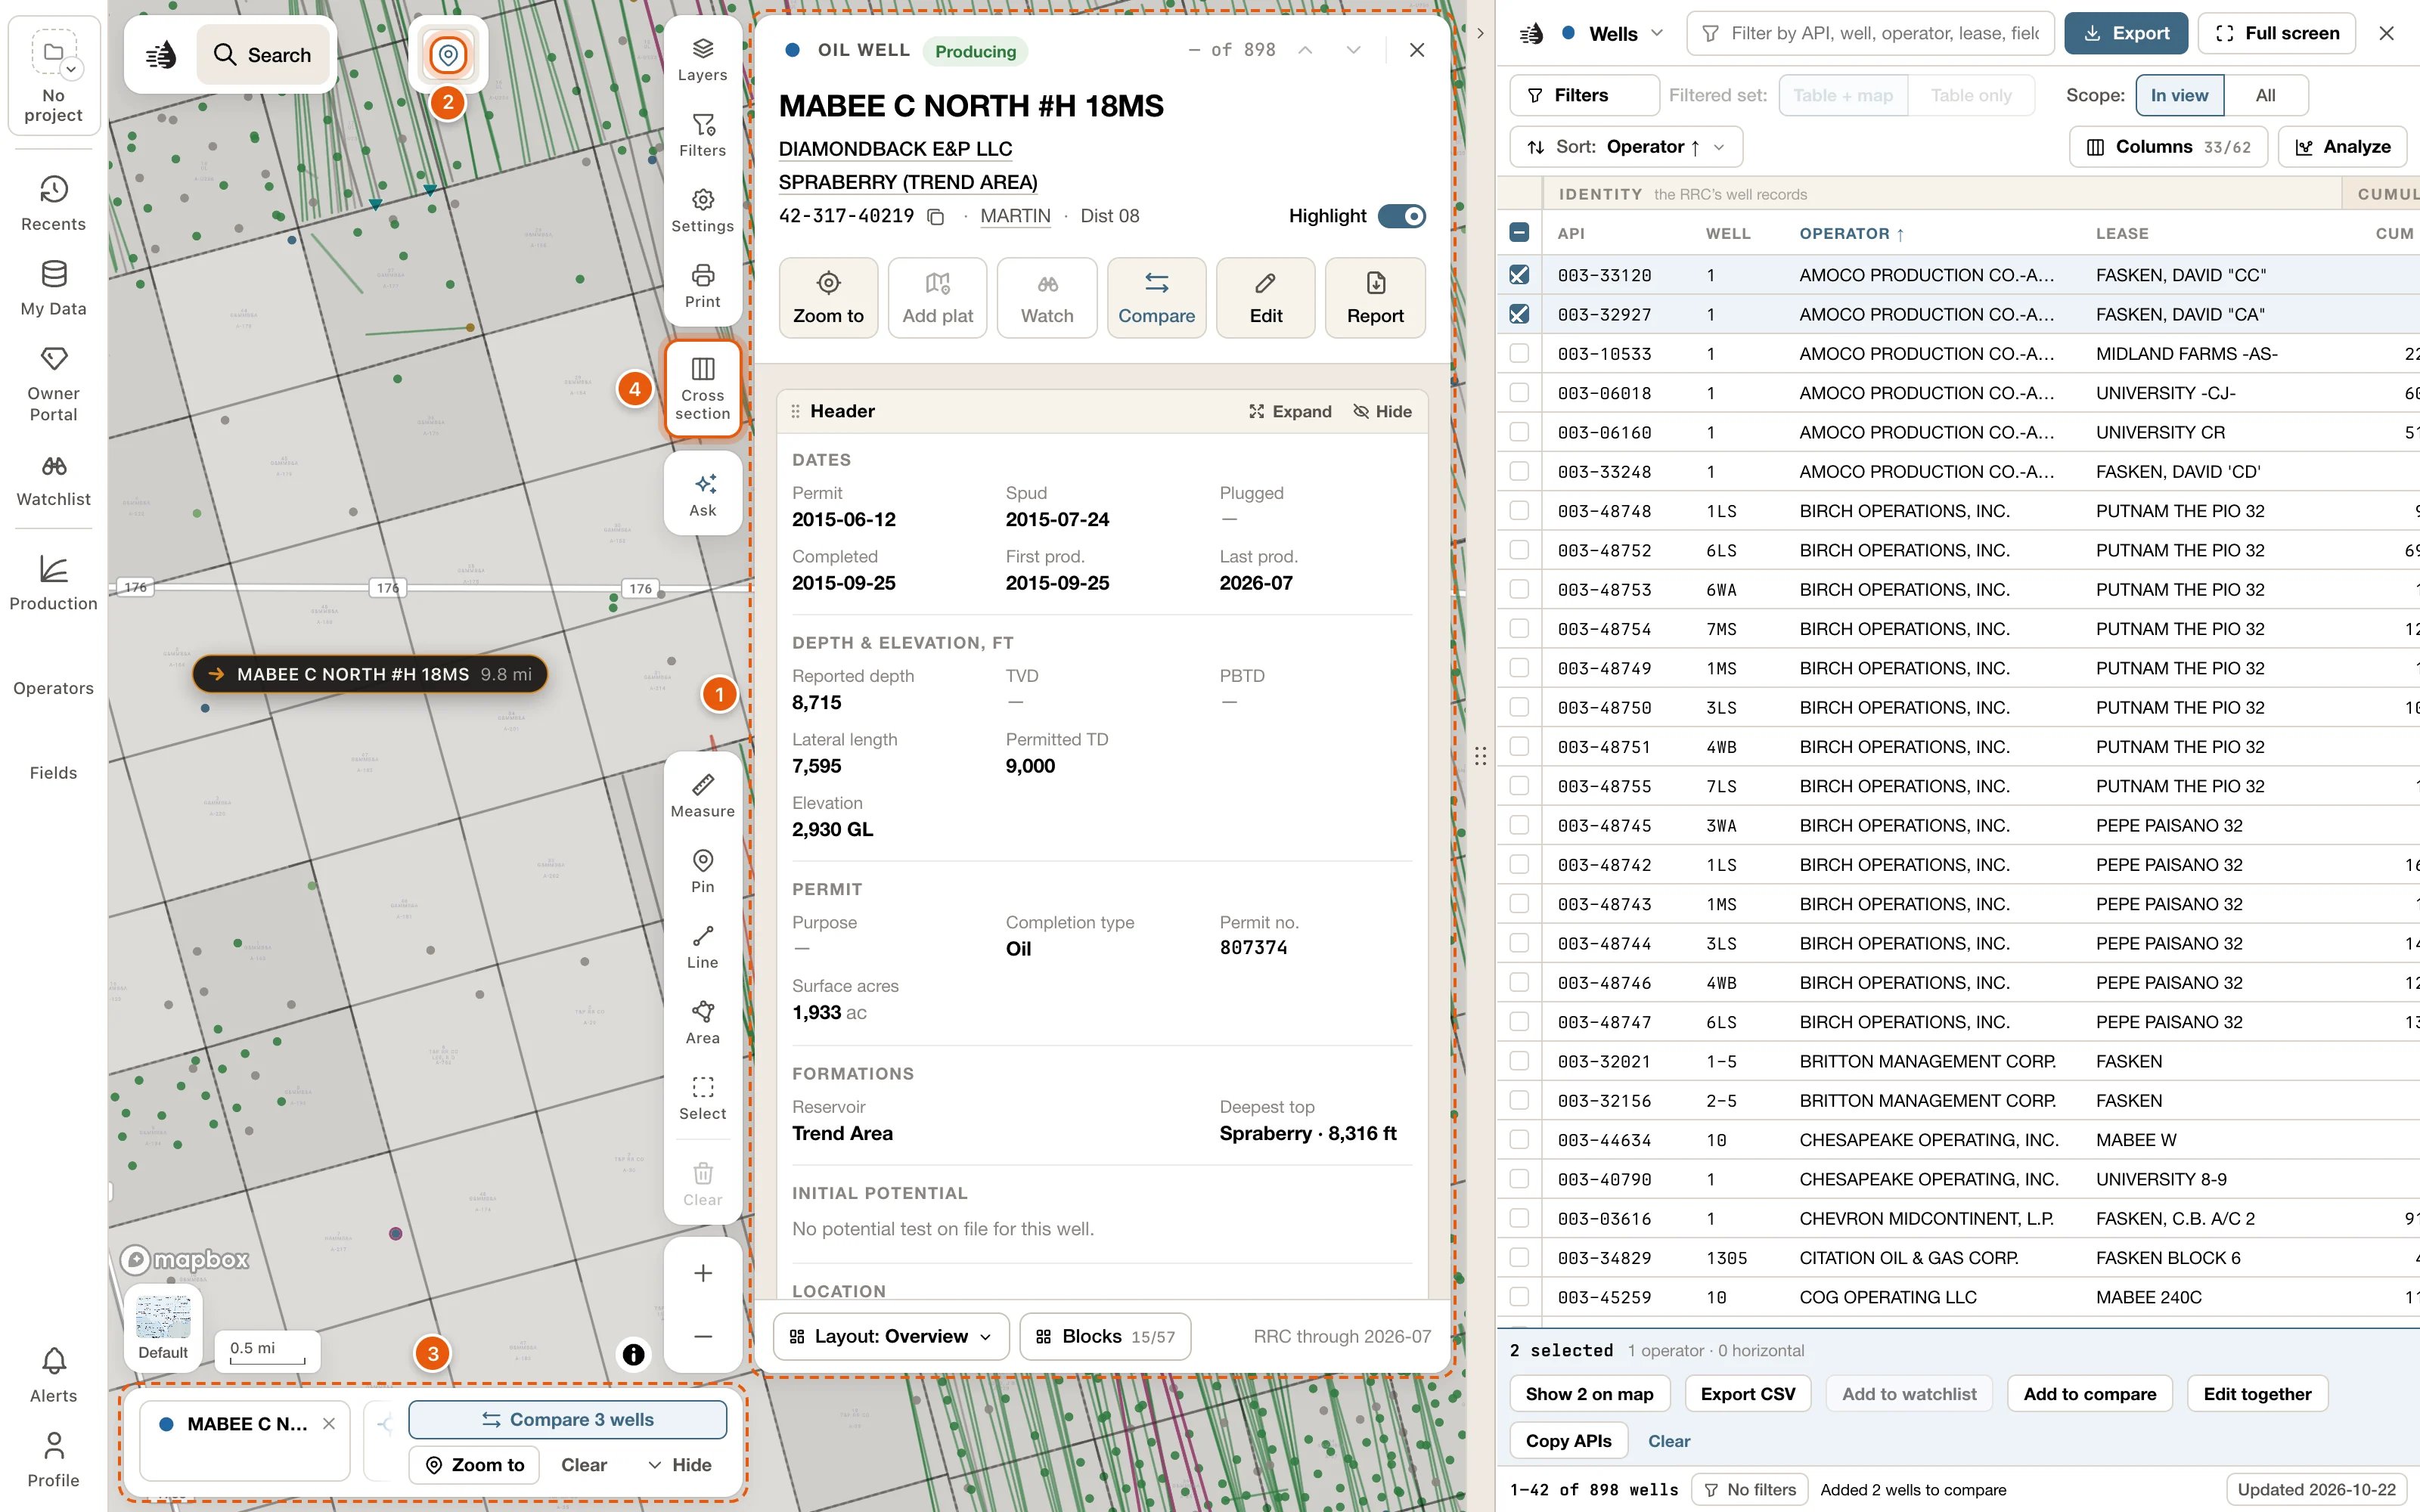
- A well, lease, operator, field or county now opens as its card, wherever you click it: the map, a popup’s View well, search, the tables or Recents. The card sits beside the tables, or on its own at the right of the map. See Record cards.
- Would you rather have records on the left, where the drawer was? Choose Settings → RECORD CARDS → Left.
- One card shows at a time. A card you open from another card has a link back to it above its name, and Esc goes back too.
- Every card is made of blocks. Add and remove them with Blocks, drag them into place, and switch arrangements with Layout. A well’s card starts with its Header: the well as the RRC files it. See card layouts.
- Every button shows its word, and cards have no More menu. A block has Expand and Hide at its top, and its own buttons, such as Export CSV and Save PNG, at its foot.
- Write synopsis, in the Synopsis block at the foot of a well, lease, operator or field card, writes a few plain sentences about the record from the RRC filings. It uses credits the first time.
- On a lease card, Expand the Production block and choose By well to see each well’s estimated share of the lease’s production.
- On a field’s or an operator’s card, Show on map opens its map settings: draw it on the map while its card is open, and choose what’s drawn.
Select an area
- Click Select in the draw tools at the bottom right, or press S. Then drag a box, draw a shape, click wells, or click tracts of the original Texas land survey. Holding Shift and dragging on the map draws a box at any time.
- Everything inside opens on a Selected area card: what the area makes now and has made over its history, its leases and operators, its activity, and its wells from the first drilled to the newest. Narrow cuts it down to the wells you want.
- Table lists the area’s wells, leases, operators, fields, frac jobs and P-4 transfers on a Selected area tab in the data tables. Export writes them as files, in one zip; see Export an area or a county.
- Cross section puts the area’s wells in a section, Save area keeps the area under a name, and Compare sets it beside other areas. See Select an area.
Counties have cards
- View county, on the place card at the top centre of the map, opens the county’s card. So does the county named on a well’s or a lease’s card.
- The card has the county’s production, activity, new wells, operators, fields, P-4 transfers, wells by status, time to drill, frac, and injection and disposal. Its Fields block ranks the county’s fields by Daily, Cumulative or Newest found, over a pie of each one’s share.
- Show wells and Show leases list the county’s wells or leases in a tab of their own. See Counties.
Export an area or a county, in one zip
- Export, on a Selected area card or a county’s card, writes its wells, monthly production, land grid, leases, outline, operators, fields, frac jobs and P-4 transfers as files for your own software. Pick the formats on each row (Shapefile, CSV, ASCII4, OWX, KML or DRI), then Download: one zip, with a README that says what each file holds. See Export an area or a county.
- The Land grid row downloads the Original Texas Land Survey’s tracts, as a shapefile or KML.
- Shapefiles are NAD27, as the RRC files well spots and the survey. KML is WGS84.
- The data tables’ exports have no limits any more. A big ASCII4, OWX, DRI or production file is written in batches, and the footer counts them off, with Cancel. See Export from the data tables.
A new search
- Results now come in four groups as you type: Leases, Wells, Fields and Operators. Every result opens its card. See Search.
- The row Search “‹text›” on screen searches only the part of the map you can see.
- A search you run stays in the search bar as one line: what you searched for, how many of its wells are on screen, and × to clear it. Click the count to open the results beside the map.
- The results have tabs (All, Leases, Wells, Fields and Operators), plus Filters, Sort and Only these on map. Click an operator, field or lease in the results to narrow them to it. See Search results.
- Filters → Area → An area you draw on the map keeps the results inside a shape you draw.
- Type an API number to open the well’s card. An operator, field or lease number opens a tab of its wells, and the map shows only those wells.
Compare
- Put wells, leases, fields, operators or selected areas side by side. Compare on a card adds the record to the compare tray at the foot of the map. So do Add to compare on ticked table rows, ⌥ Enter in search, and Compare in a well popup.
- The tray holds up to 12 of each kind. Compare ‹N› wells (or leases, fields, operators or areas) opens their production overlaid or side by side, and their facts in a grid. Differences only hides the facts they share. See Compare.
Well logs, cross-sections, formation tops and well records
- Turn on Logs in Layers to mark every well with a log on record. In a well popup, More → Logs opens the well’s log in a Log tab beside the map. See Well logs on the map.
- Click Cross section on the right of the map (or press X), then click wells in order. The section shows their tops, perforations, tests and cores side by side. You can flatten it on a formation, show the rock, and pick your own tops with Pick tops. See Cross-sections.
- The Formation tops layer maps a formation’s Structure, its thickness (Isopach) or its Depth from the tops in view. On a well’s card, Edit tops (or Add a top) adds your own picks. My Data lists your picks and formations. See Formation tops.
- The Records block on a well’s card keeps tests, cores, completions, casing, shows and notes at their depths, shared with your team. Add them with Edit on the block, or by dragging along a well in a cross-section. See Well records.
Ask draws on the map, and makes pages you can share
- Ask now opens a column beside the map. As it answers, it can move the map, mark and highlight wells, turn on layers and open records. See The place card and Ask.
- You can take back anything Ask changed: the Ask row at the bottom of the map has Undo, and New thread, at the top of the column, starts over and clears its changes. Your earlier threads are under History. Asking uses credits.
- Ask can publish an answer as a page of its own. Share it with people or by link, refresh its data, and go back to an earlier version. See Pages from Ask.
My Wells
- Edit on a well’s card lets you correct its operator, status, location, depths, dates and more. Your team sees your values, and you see theirs. If you’re not part of an organization, your values are yours alone. See Your values and your team’s.
- In My Data, open the My wells row to add a well the RRC doesn’t have (Add well), or to import wells and records: IHS / S&P Global scout tickets as a PDF, or a table (CSV, Excel, GeoJSON, KML or a zipped shapefile). Your wells show on the map, in the tables and in search. See My Wells.
Color wells by your data, and production units
- The Wells row in Layers has a style button, Style: Type at first. It colors every well on the map by a figure from its record, such as TD or Spud year, by an attribute of yours, or by the records kept on it. A legend says what the colors mean. See Style wells by your data.
- Production units, a new layer under ANALYTICS in Layers, draws each producing well as the land it produces from, colored by how big a well it is, how it ranks in its field, or its boe per acre. See Production units.
Operator and field layers, and the Production panel
- Operators and Fields on the left rail now open panels. Put any operator or field on the map in a color of its own, add the top producers in view with one click, and compare their rates on one chart. See Operator and field layers.
- Production on the left rail shows what the area in view produces: its total, a chart, and its leases, operators and fields ranked by boe/d. Export CSV downloads the list you’re on. See Production in view.
The place card, map data, the status bar and the well popup
- The place you’re looking at now sits on its own at the top centre of the map. Its card lists the leases in view by boe/d (or the wells in view where nothing produces), with Zoom to county and View county. See The place card and Ask.
- Settings → SUPPORT → Map data… tells you in one sentence what’s stored on this device, with Download all and Clear all map data. It replaces the old switch for keeping a copy. Until the wells, leases and fields are on this device, the QuickScout server answers for them, so the tables, search and cards work from the start. P-4 and Frac aren’t downloaded at all: the server always answers them. See Map data on this device.
- To keep no map data on a computer at all, switch off Keep map data on this device under Where answers come from in Map data. The server then answers the tables, search and cards. See Answer from the server instead.
- The status bar at the bottom left shows the scale and your pointer’s coordinates. Click it to add the zoom, a scale ratio, or the county, abstract and survey under your pointer. See Map settings.
- The well popup is new: the lease’s production, the well’s depths and dates, then View well and Compare. More holds Logs, Documents, Land & owners and RRC GIS. Under Settings → WELL POPUP, Standard is the default size; Large and Extra large draw the same popup bigger. See The well popup.
Drilling timeline, W-1 plats and printing in Safari
- The drilling timeline now lets you choose which wells it plays: All, Vertical or Horizontal wellbores, the years they were drilled (From and To), and up to 10 operators (Add operator), each in a color of its own. Zoom to frames the operators’ wells. Horizontal wells are drawn along their laterals. See Drilling timeline.
- Add plat on a well’s card lays the well’s W-1 plat over the map, where the surveyor drew it. Layers → W-1 plats lists the plats you’ve added. See W-1 plats on the map.
- Printing a map now works in Safari: Export PDF opens the print dialog, and Save PNG saves the whole sheet. See Print a map.
Your plan, and Billing in the Profile menu
- Profile shows your plan under your email, such as Free account or Independent · $250/month. See Your account menu.
- See plans (on a free account) and Billing (on a plan of your own) replace Manage Subscription. See Manage billing.
- Subscribe from Maps and, once you’ve paid, the map opens again at the same view, with the record you were opening. See Subscribe.
- Projects, watchlists and deals, parts of the Enterprise workspace (called Prospect in some places), now come with every paid plan: the project tile and Watchlist on the left rail, Watch on a card, Add to watchlist, Add to project scope, New project from these and Add to deal draft on ticked rows, and the Deals tab. See Paid plans.