

Operators
One row is one operator, totalled over its leases in view. It answers who operates here, and how big are they?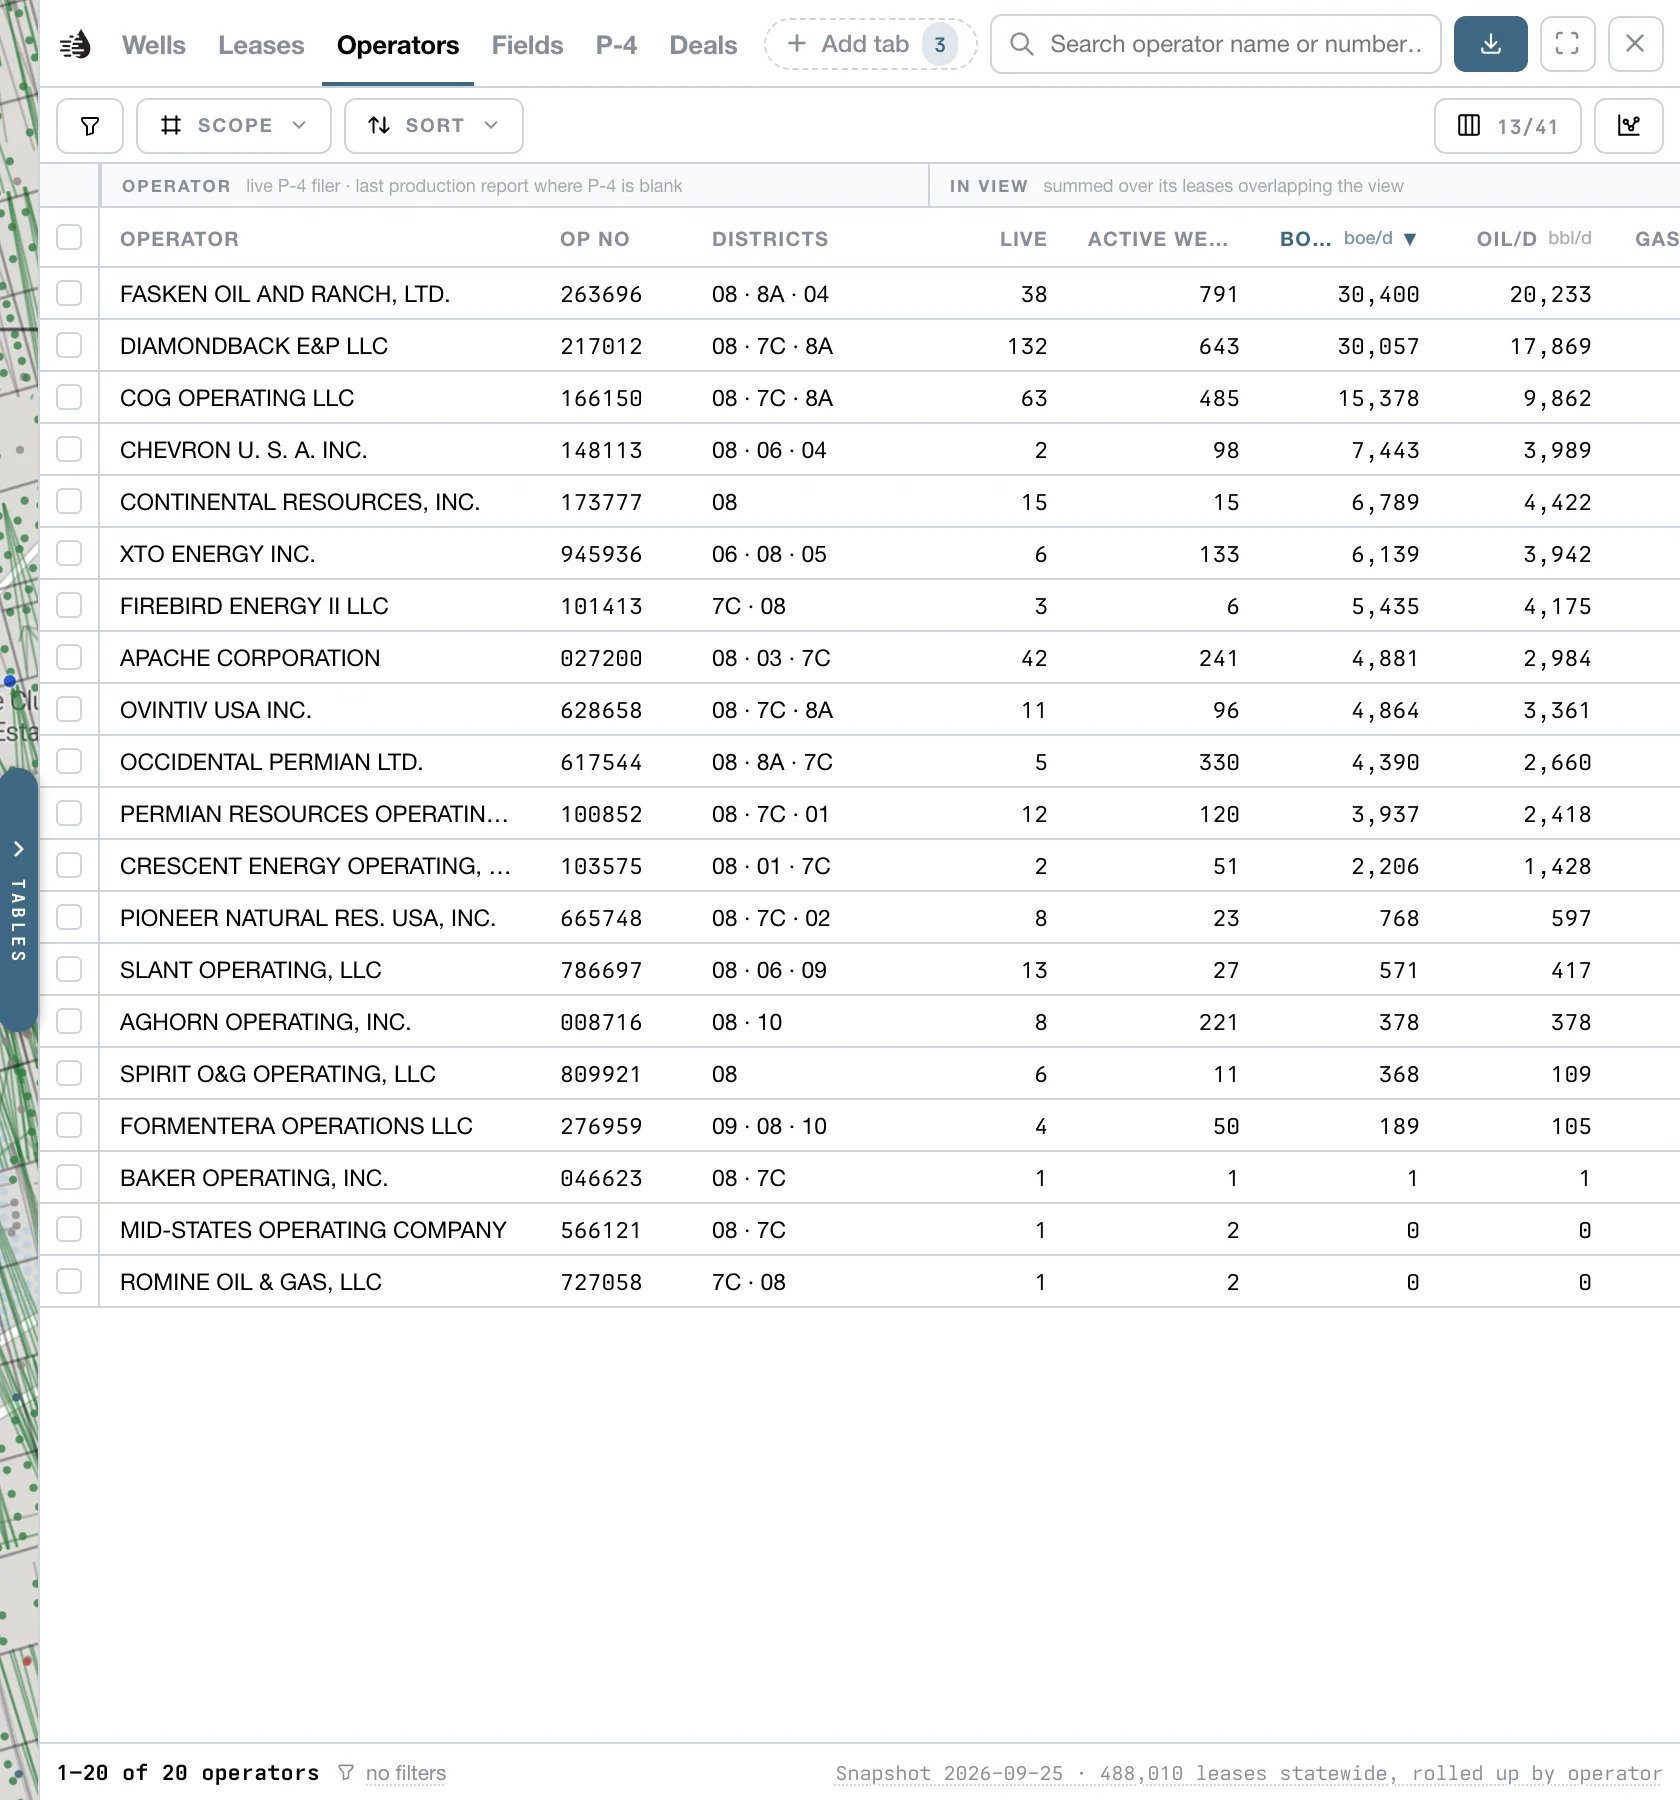
What in view means
Scope → In view lists operators with at least one lease in the map’s visible area, and totals only those leases. Pan to Reeves County and BOE/d is each operator’s production in Reeves. Statewide totals every lease in Texas. Rows start sorted by BOE/d, highest first.Views
Pick a view under Columns:
A few columns worth knowing:
- BOE/d is oil per day plus gas per day divided by 6.
- Share of TX oil is how much of the operator’s Texas oil comes from the leases in view. 80% means this area is most of their business.
- Pending P-4 counts live leases where this operator has filed a P-4 but the production reports still name someone else. It’s an early sign of an acquisition.
- Districts are the operator’s top three RRC districts statewide.
- Columns in the Texas group are statewide whatever the view.
Filters
Quick pills: producing, ≥100 live leases, pending P-4, mostly here (at least half their Texas oil is in view), drilling (spudded a well in the last 12 months), permitting and valued. Operators whose leases here are all dead or archived are hidden, so the list is who operates here today. The No live lease pill brings them back. The search box finds an operator by name, or by RRC operator number.Hover and the map
Hover a row to spotlight that operator: the rest of the map dims, and the operator’s leasehold, wells and laterals are drawn in blue. Hovering a bar on a chart spotlights every operator in it.The operator card
Click a row to open its card.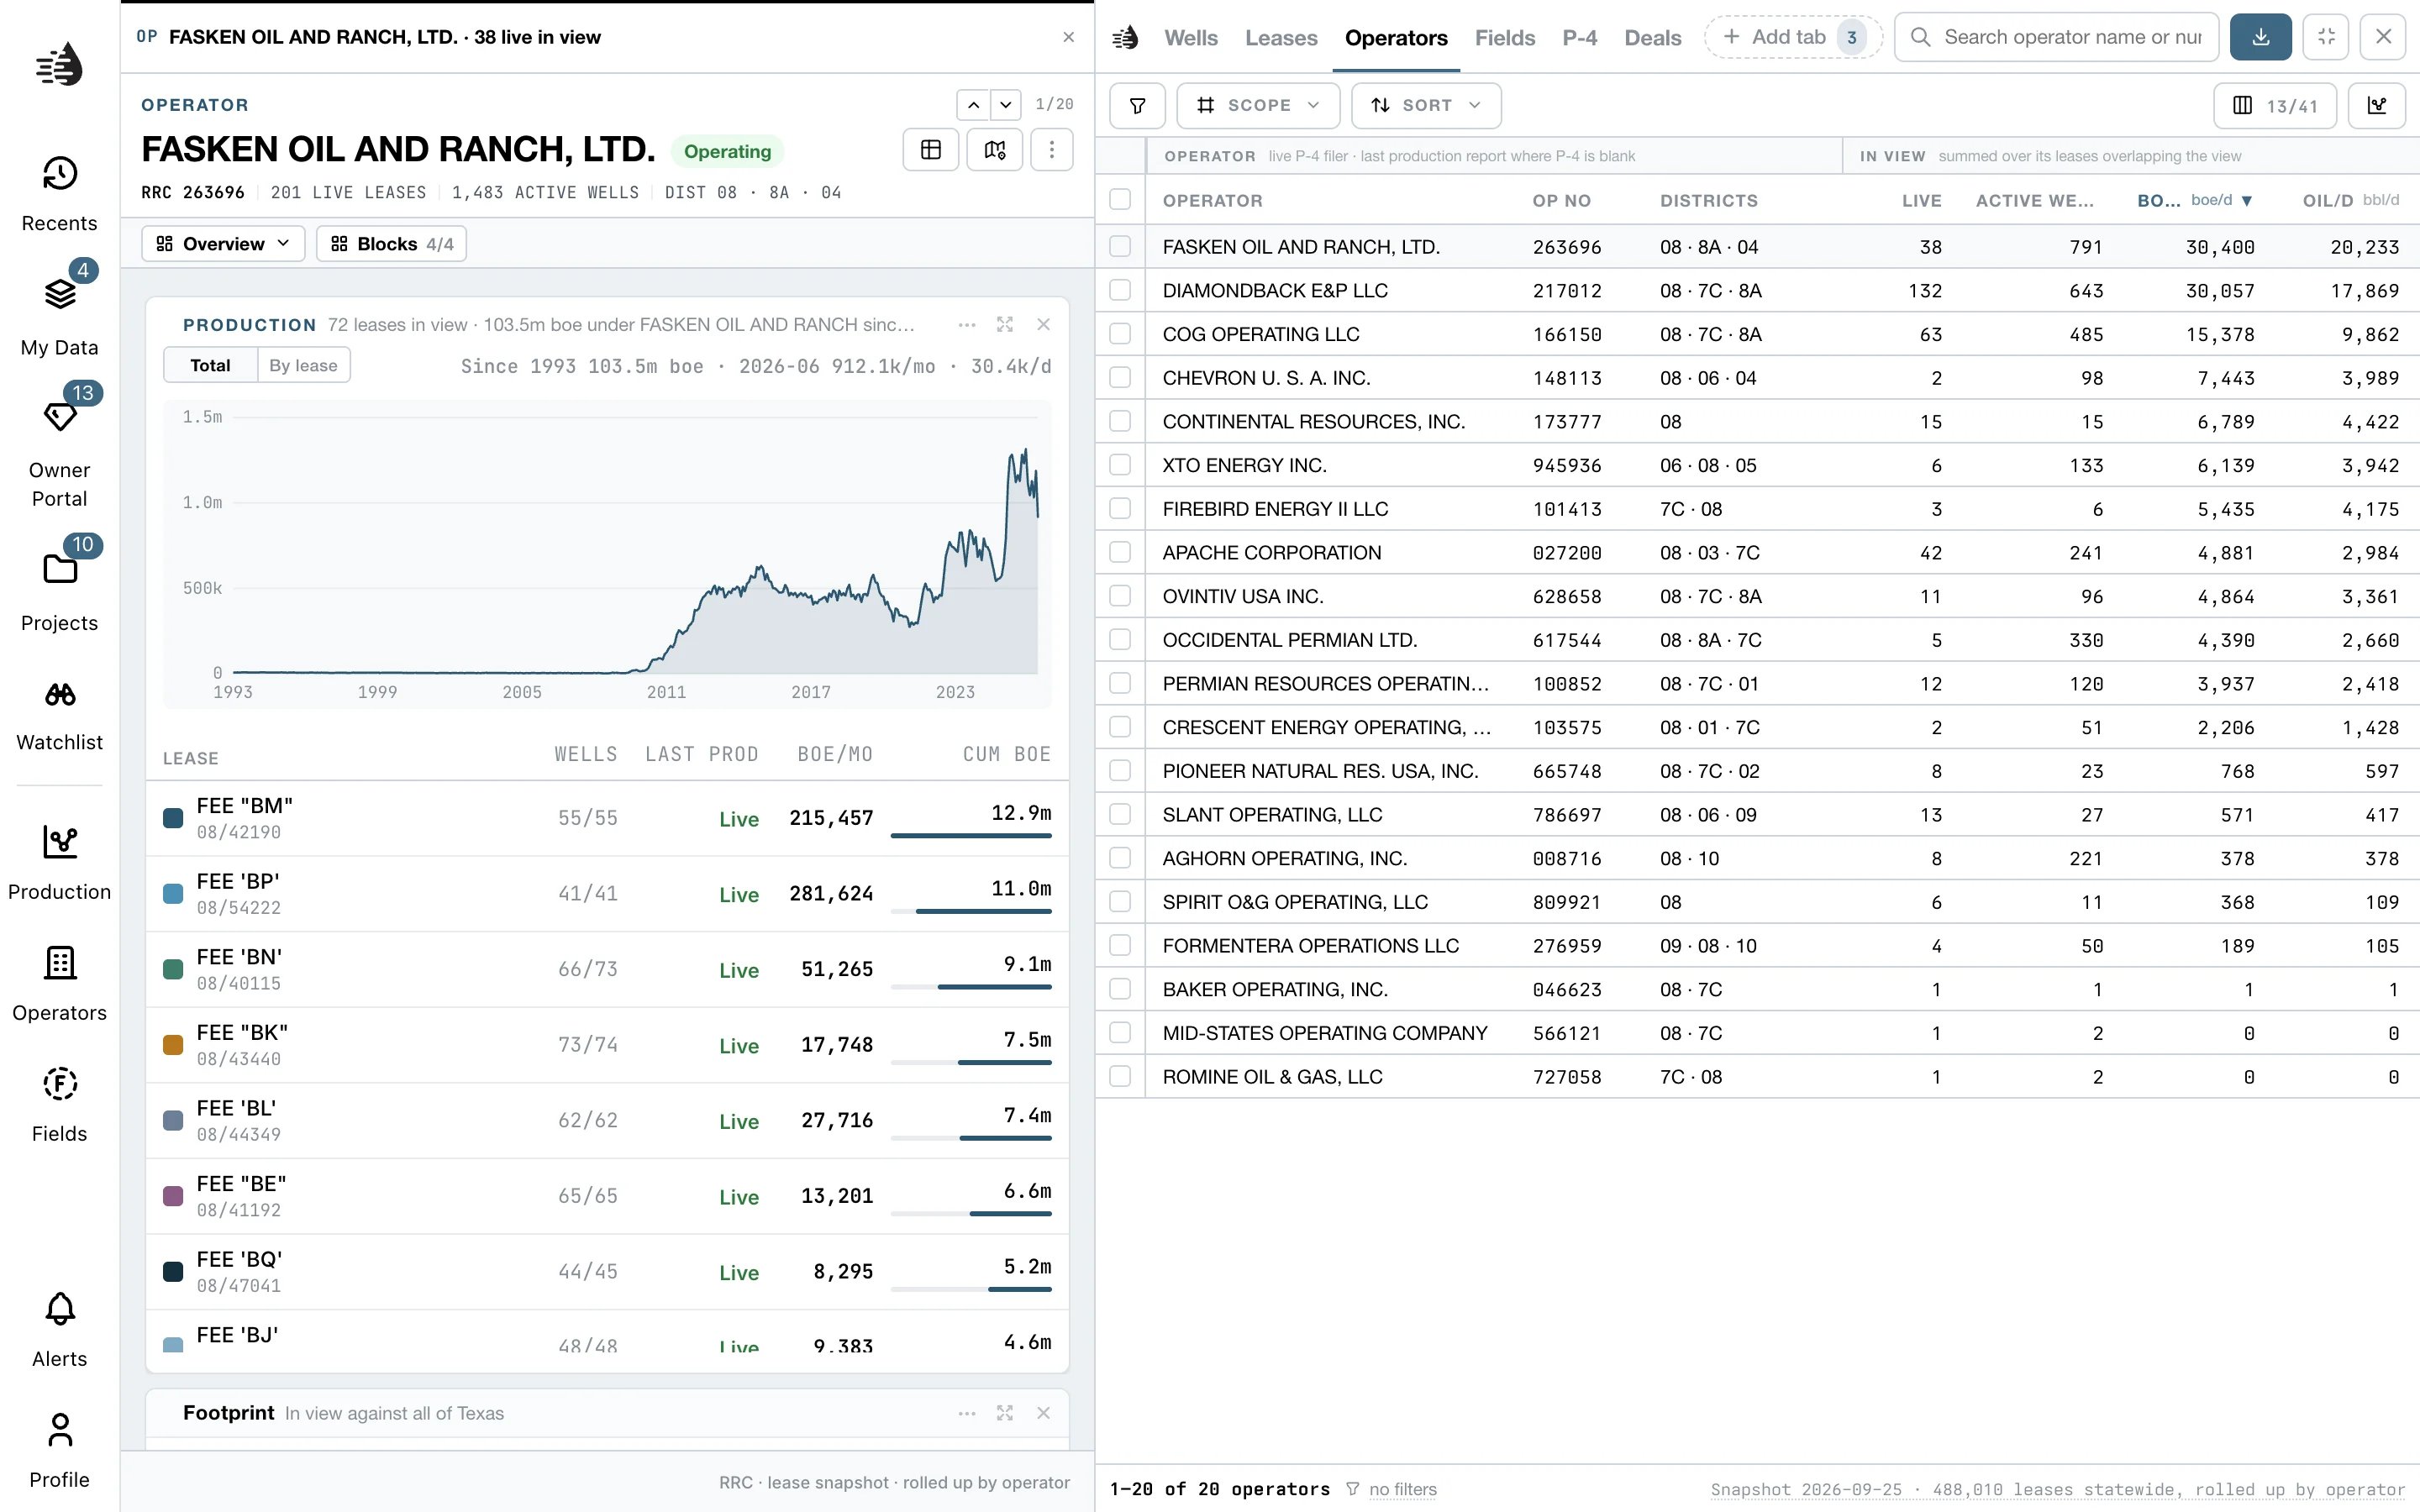
- Show leases switches to the Leases tab, filtered to this operator.
- Show on map keeps the operator’s leases and wells colored on the map. Hide on map stops it.
- The ⋯ menu has Copy operator number and Copy operator name.
- Production: the operator’s monthly production. Total charts it as one; By lease splits it by lease. Below, every lease is listed with its wells, last production month, BOE a month and cumulative BOE. Click a lease to take it out of the chart; Show all puts it back. Hover a lease to light its wells on the map.
- Footprint: leases, live leases, active wells, BOE, oil and gas IN VIEW, across TEXAS, and the SHARE here.
- By district: BOE/d or leases in each RRC district.
- Valuation: needs the lease valuation add-on.
Fields
One row is one RRC field number. For each field, the tab shows what the RRC says it has made in its lifetime, how much of that the map can place on leases it can draw, and why the rest can’t be placed.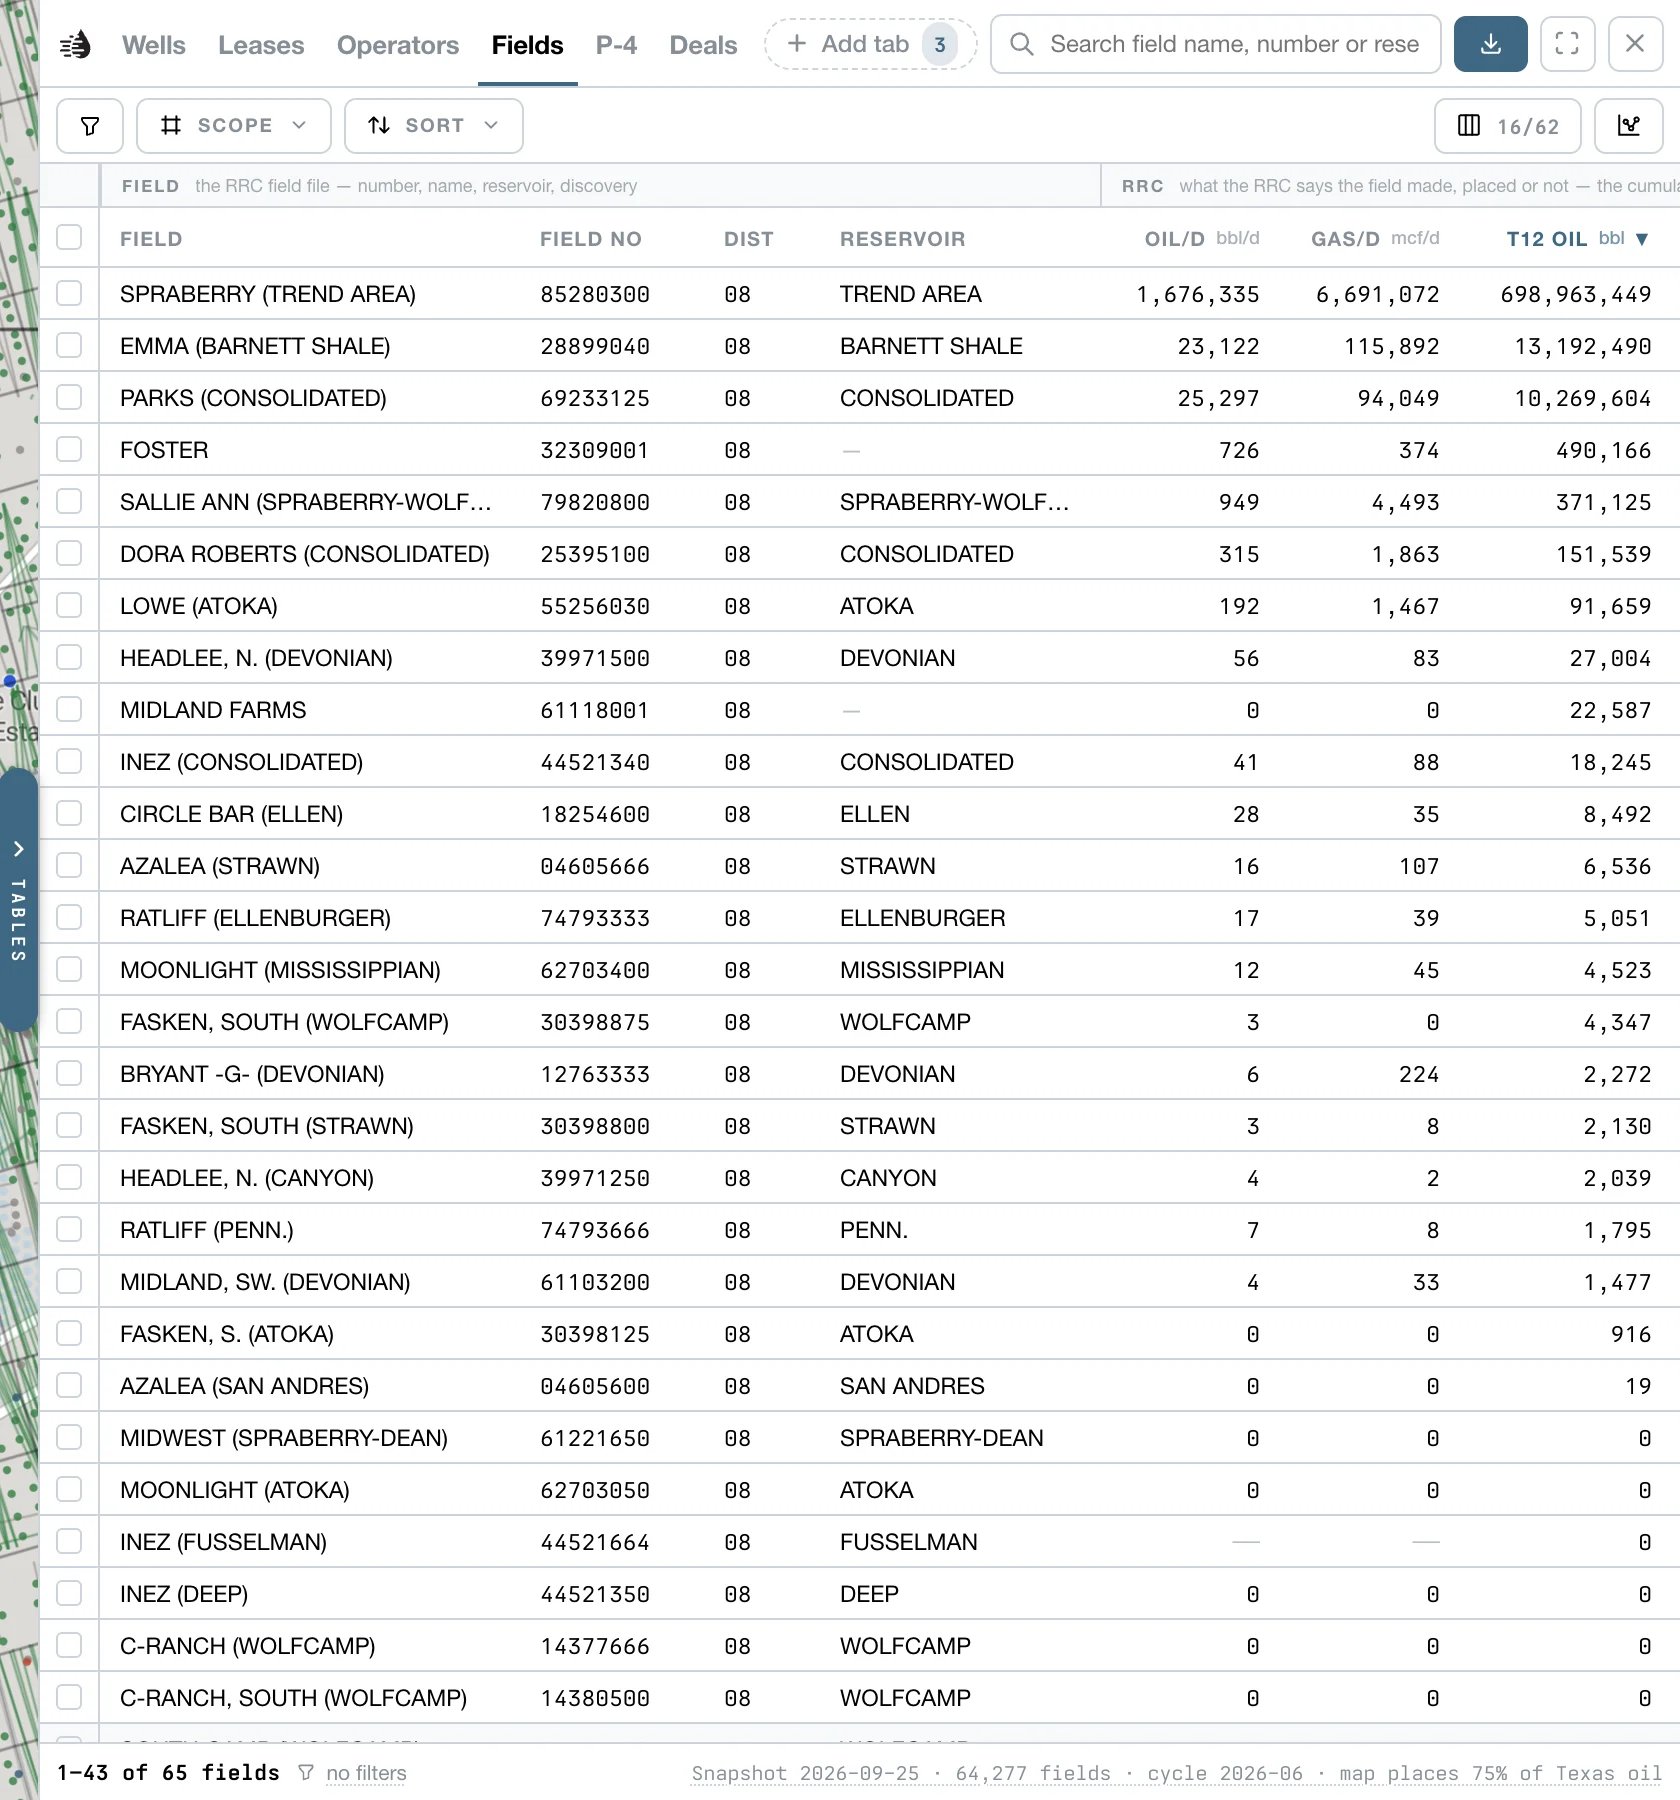
What in view means
A field is in view when at least one of its wells is on the map. A field with nothing in view shows up under Statewide, and so does a retired field number, which has no wells. The Fields tab needs the Wells data on your device to decide what’s in view. Until it’s there, the footer reads Waiting for the wells snapshot. Rows start sorted by trailing-12-month oil, highest first. Sort also offers Nearest the map centre.Placed, and the gap
The RRC keeps a lifetime total for every field, going back decades. The map can only draw production that sits on a lease it has a location for, and monthly lease records only start in 1993 (with an older archive before that). So the tab splits each field’s lifetime three ways:- Placed: production on leases the map can draw, since 1993 and from the archive before it. Oil covered and Gas covered are that as a share of the RRC total. Green is 95% or more.
- Lost leases: old producers with no location anywhere. They’re tied to the field and counted, but can’t be drawn.
- Older than the archive: history from before any lease record QuickScout holds. The archive starts in 1955 (1964 in District 6E).
- Retired no.: the RRC moved this number’s production to other field numbers. Retired rows are dimmed.
- Excess: the leases carry more than the field’s own total. This happens when a successor field number’s leases kept their months from before the renumbering. A coverage over 100% is real, not an error.
Views
Filters
Quick pills: oil this year, gas this year, lost leases, older than the archive, excess on successors, retired number and gas field. The search box finds a field by name, number or reservoir.Hover and the map
Hover a row to see where the field is: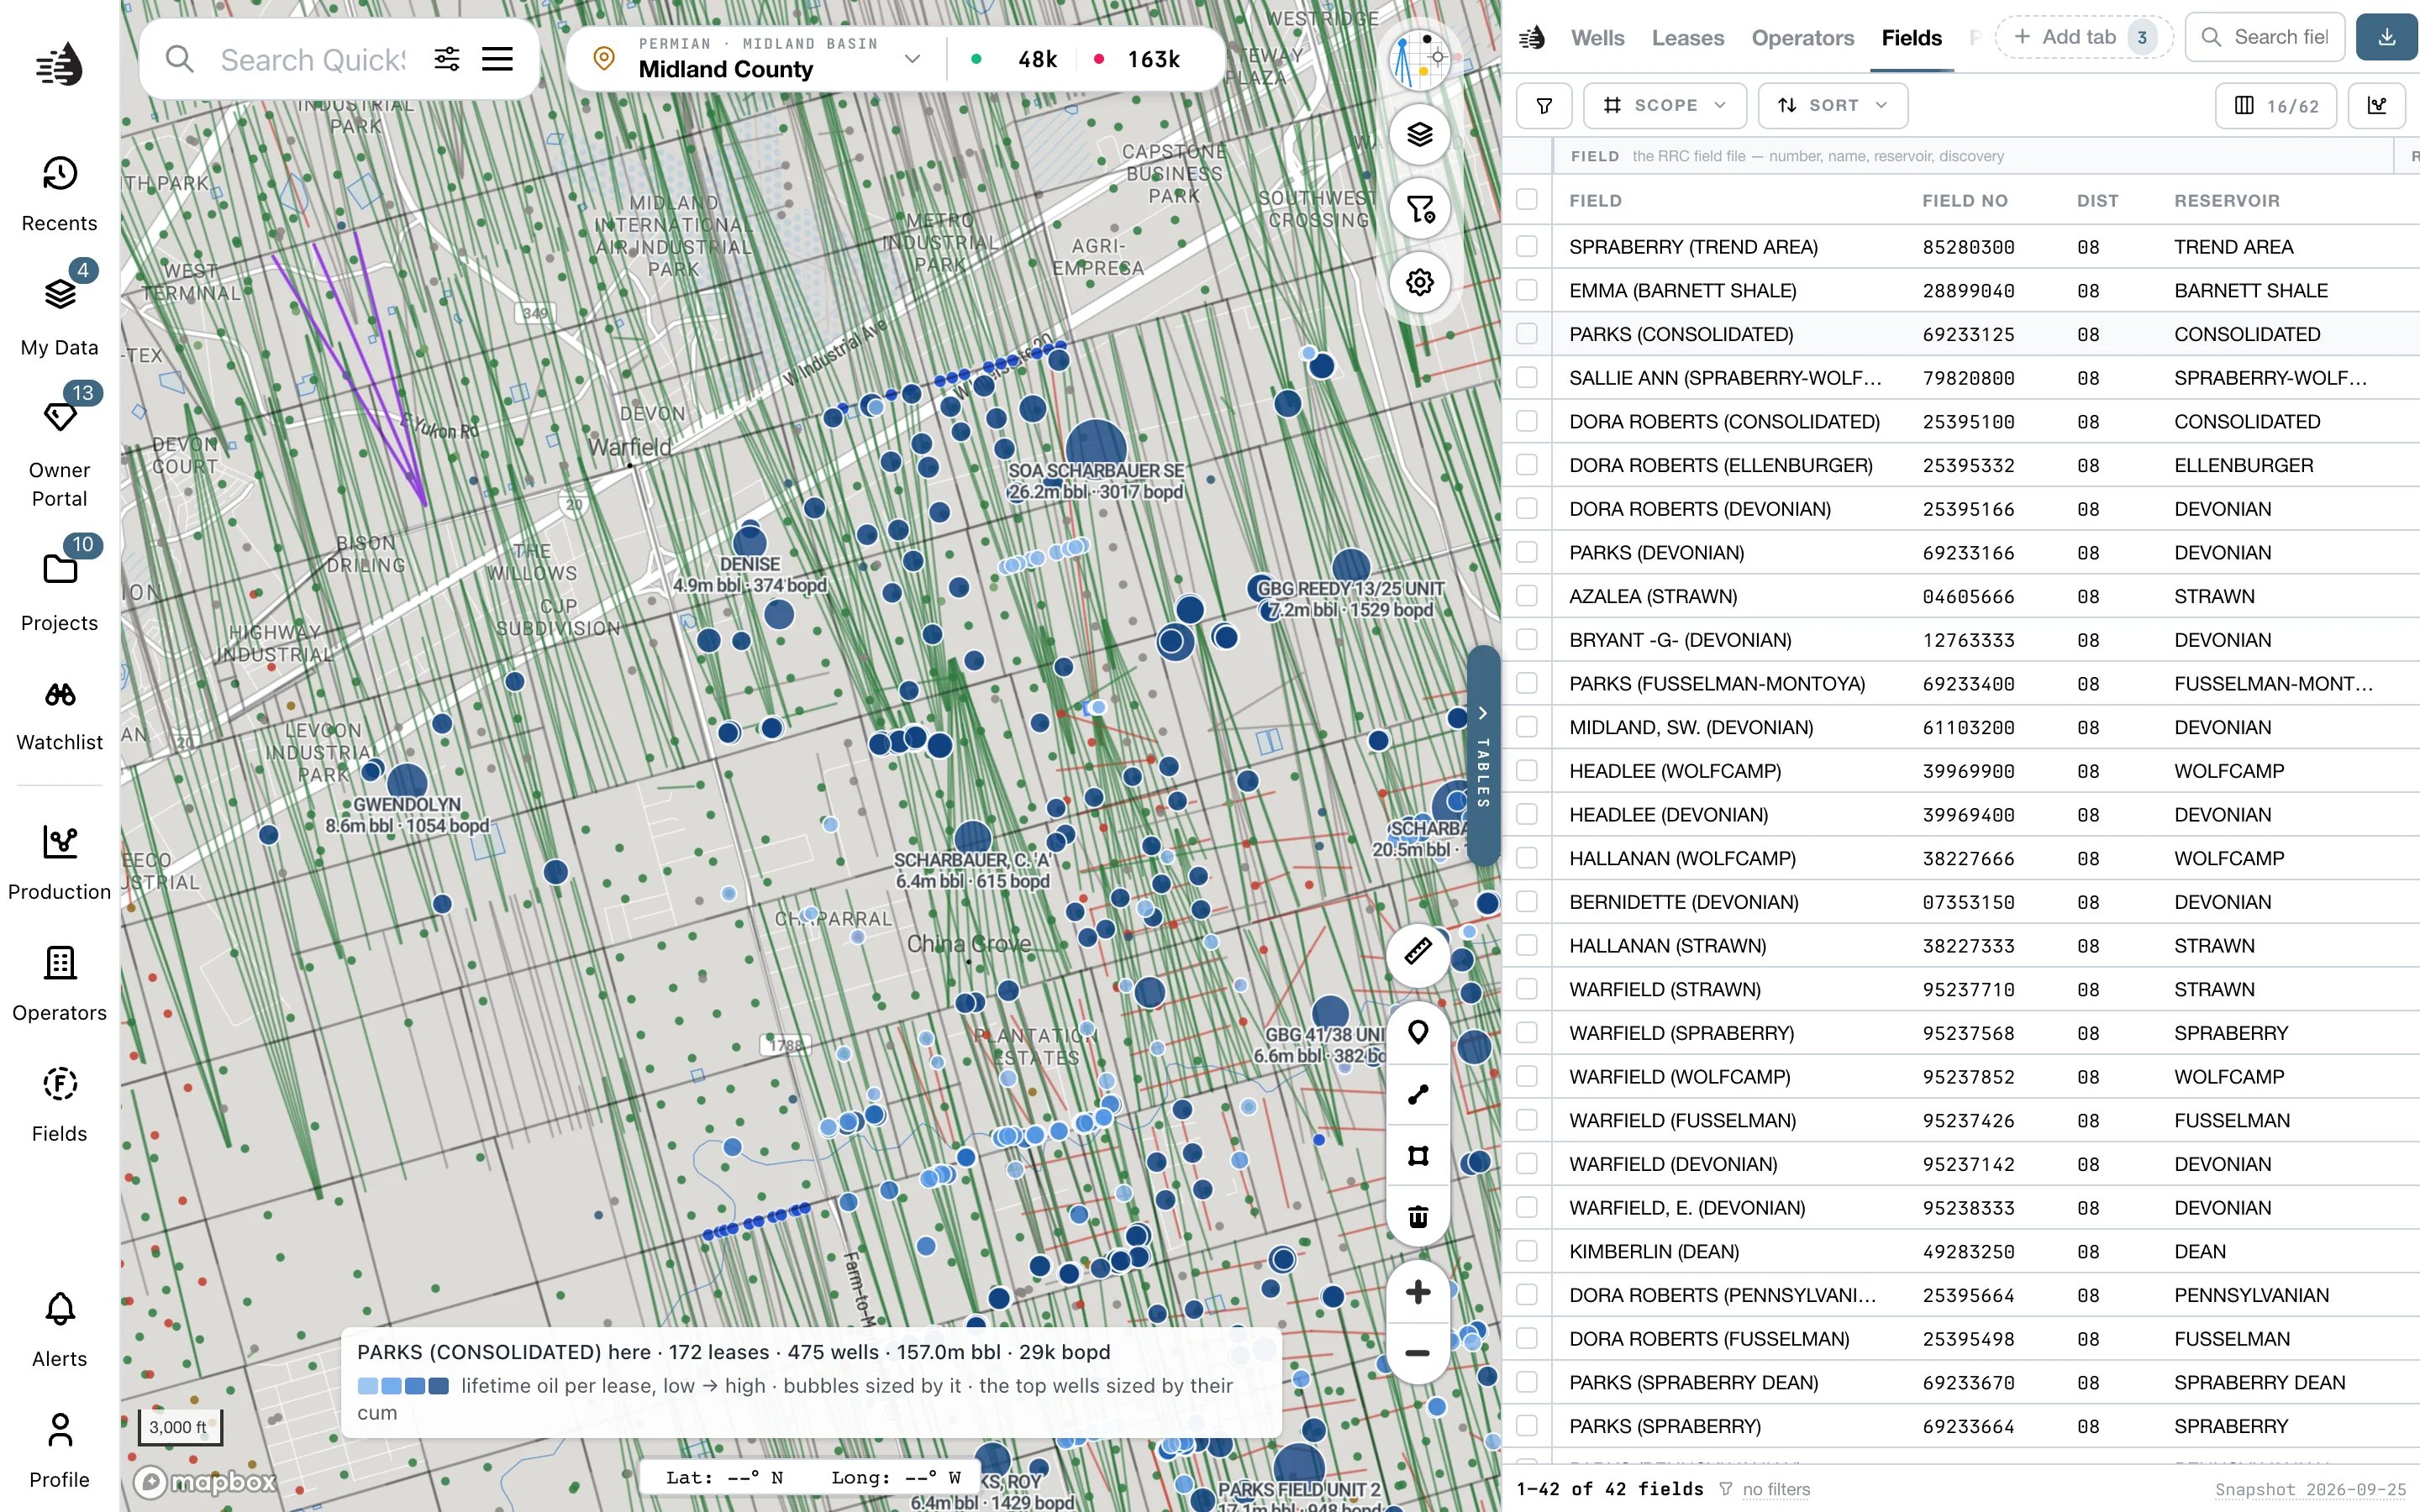
- Zoomed out (below zoom 10): a box around the field’s wells, with a pin at its centre.
- Zoomed in: the field’s leases, each in its own color, labeled with its lifetime and current oil (for example 1.2m bbl · 799 bopd). Its wells are colored by their lease and sized by what they made. From zoom 12.5, each well shows its allocated cumulative oil above it, such as ~120k. The ~ means the figure is an estimate.
- The biggest fields, like the Spraberry Trend, have too many leases to draw one by one. Each lease becomes a bubble sized and shaded by its lifetime oil, and a chip at the bottom of the map sums up the field.
The RRC reports oil by lease, so a well’s share of its lease’s oil is allocated from well tests. Treat per-well figures as estimates.
The field card
Click a row to open its card. While the card is open, its field stays drawn on the map.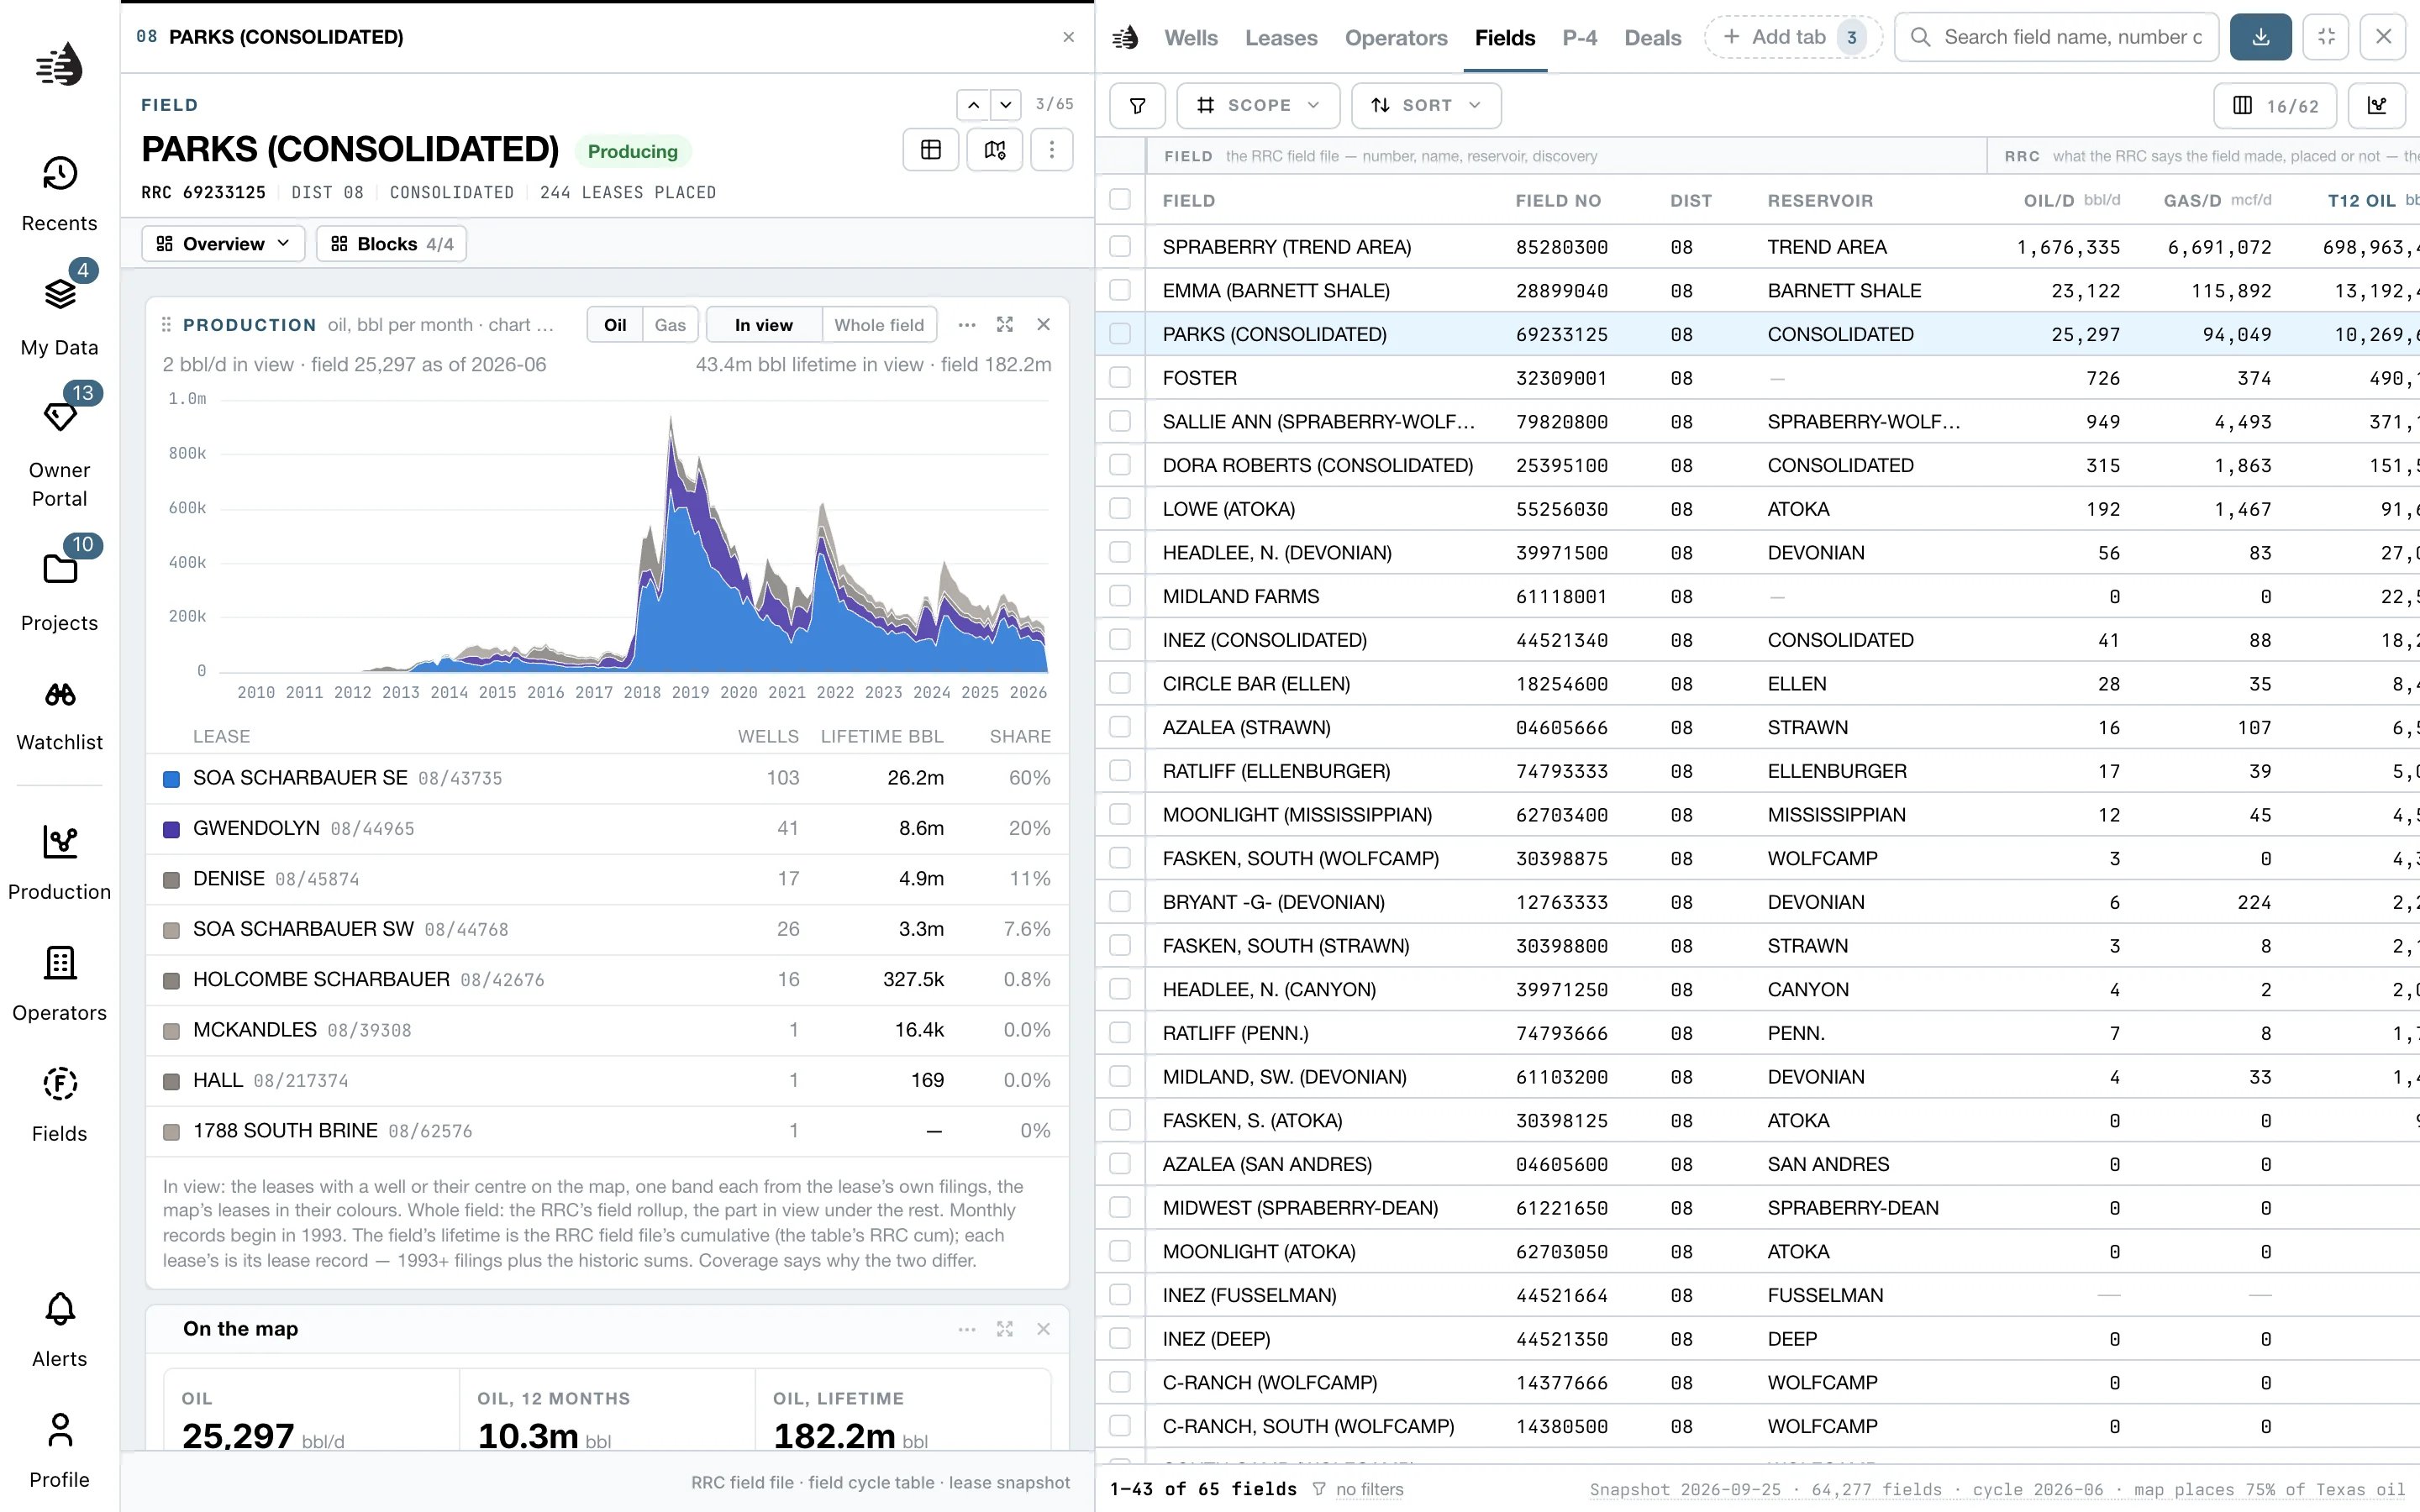
- Show leases switches to the Leases tab, filtered to this field’s leases.
- Show on map draws the field’s outline. Hide on map removes it.
- The ⋯ menu has Open field record, Copy field number and Copy field name.
- Production: monthly production since 1993. Oil / Gas switches the product. In view charts only the leases on the map, one band each. Whole field charts the whole field, split into In view and Rest of the field. The lease list underneath works the same way.
- On the map: oil and gas now, over 12 months and lifetime, and how many leases and wells the map holds.
- Record: field number, district, reservoir, class, discovery date, counties and peak month.
- Coverage: the field’s RRC lifetime oil and the share the map can place, as a bar split into Since 1993, Placed, before 1993, Lost leases and Older than the archive.
Move between cards
Cards link to each other, so you can follow a thread without leaving the table:- On a field card, click a lease in the Production list to open that lease’s card. ↑ / ↓ step through the field’s leases.
- On a lease card, click the field name to open the field’s card, or the operator to open the operator’s card.
- The crumb at the top of the card (‹ field name) or Esc takes you back.
The map follows the table
Once a filter or search is on, Filtered set → Table + map narrows the map’s lease footprints to the matching operators’ or fields’ leases. On Operators, the wells narrow too. See Filters & the map.Charts
Analyze → Charts has recipes for both tabs.- Operators: BOE/d by operator, PV-10 by operator, Leases × BOE/d, Here vs Texas and Share of TX oil in view.
- Fields: RRC lifetime oil by field, Oil this year by field, RRC lifetime gas by field, Gas this year by field, How much the map can place, Lost oil by field, Older than the archive, by field and RRC lifetime × placed.
Export
The CSV carries the columns you have showing, in their order, with no row limit. The file is named for the tab, the place and the date, for example
operators-reeves-county-2026-09-25-214-rows.csv. See Export data.