

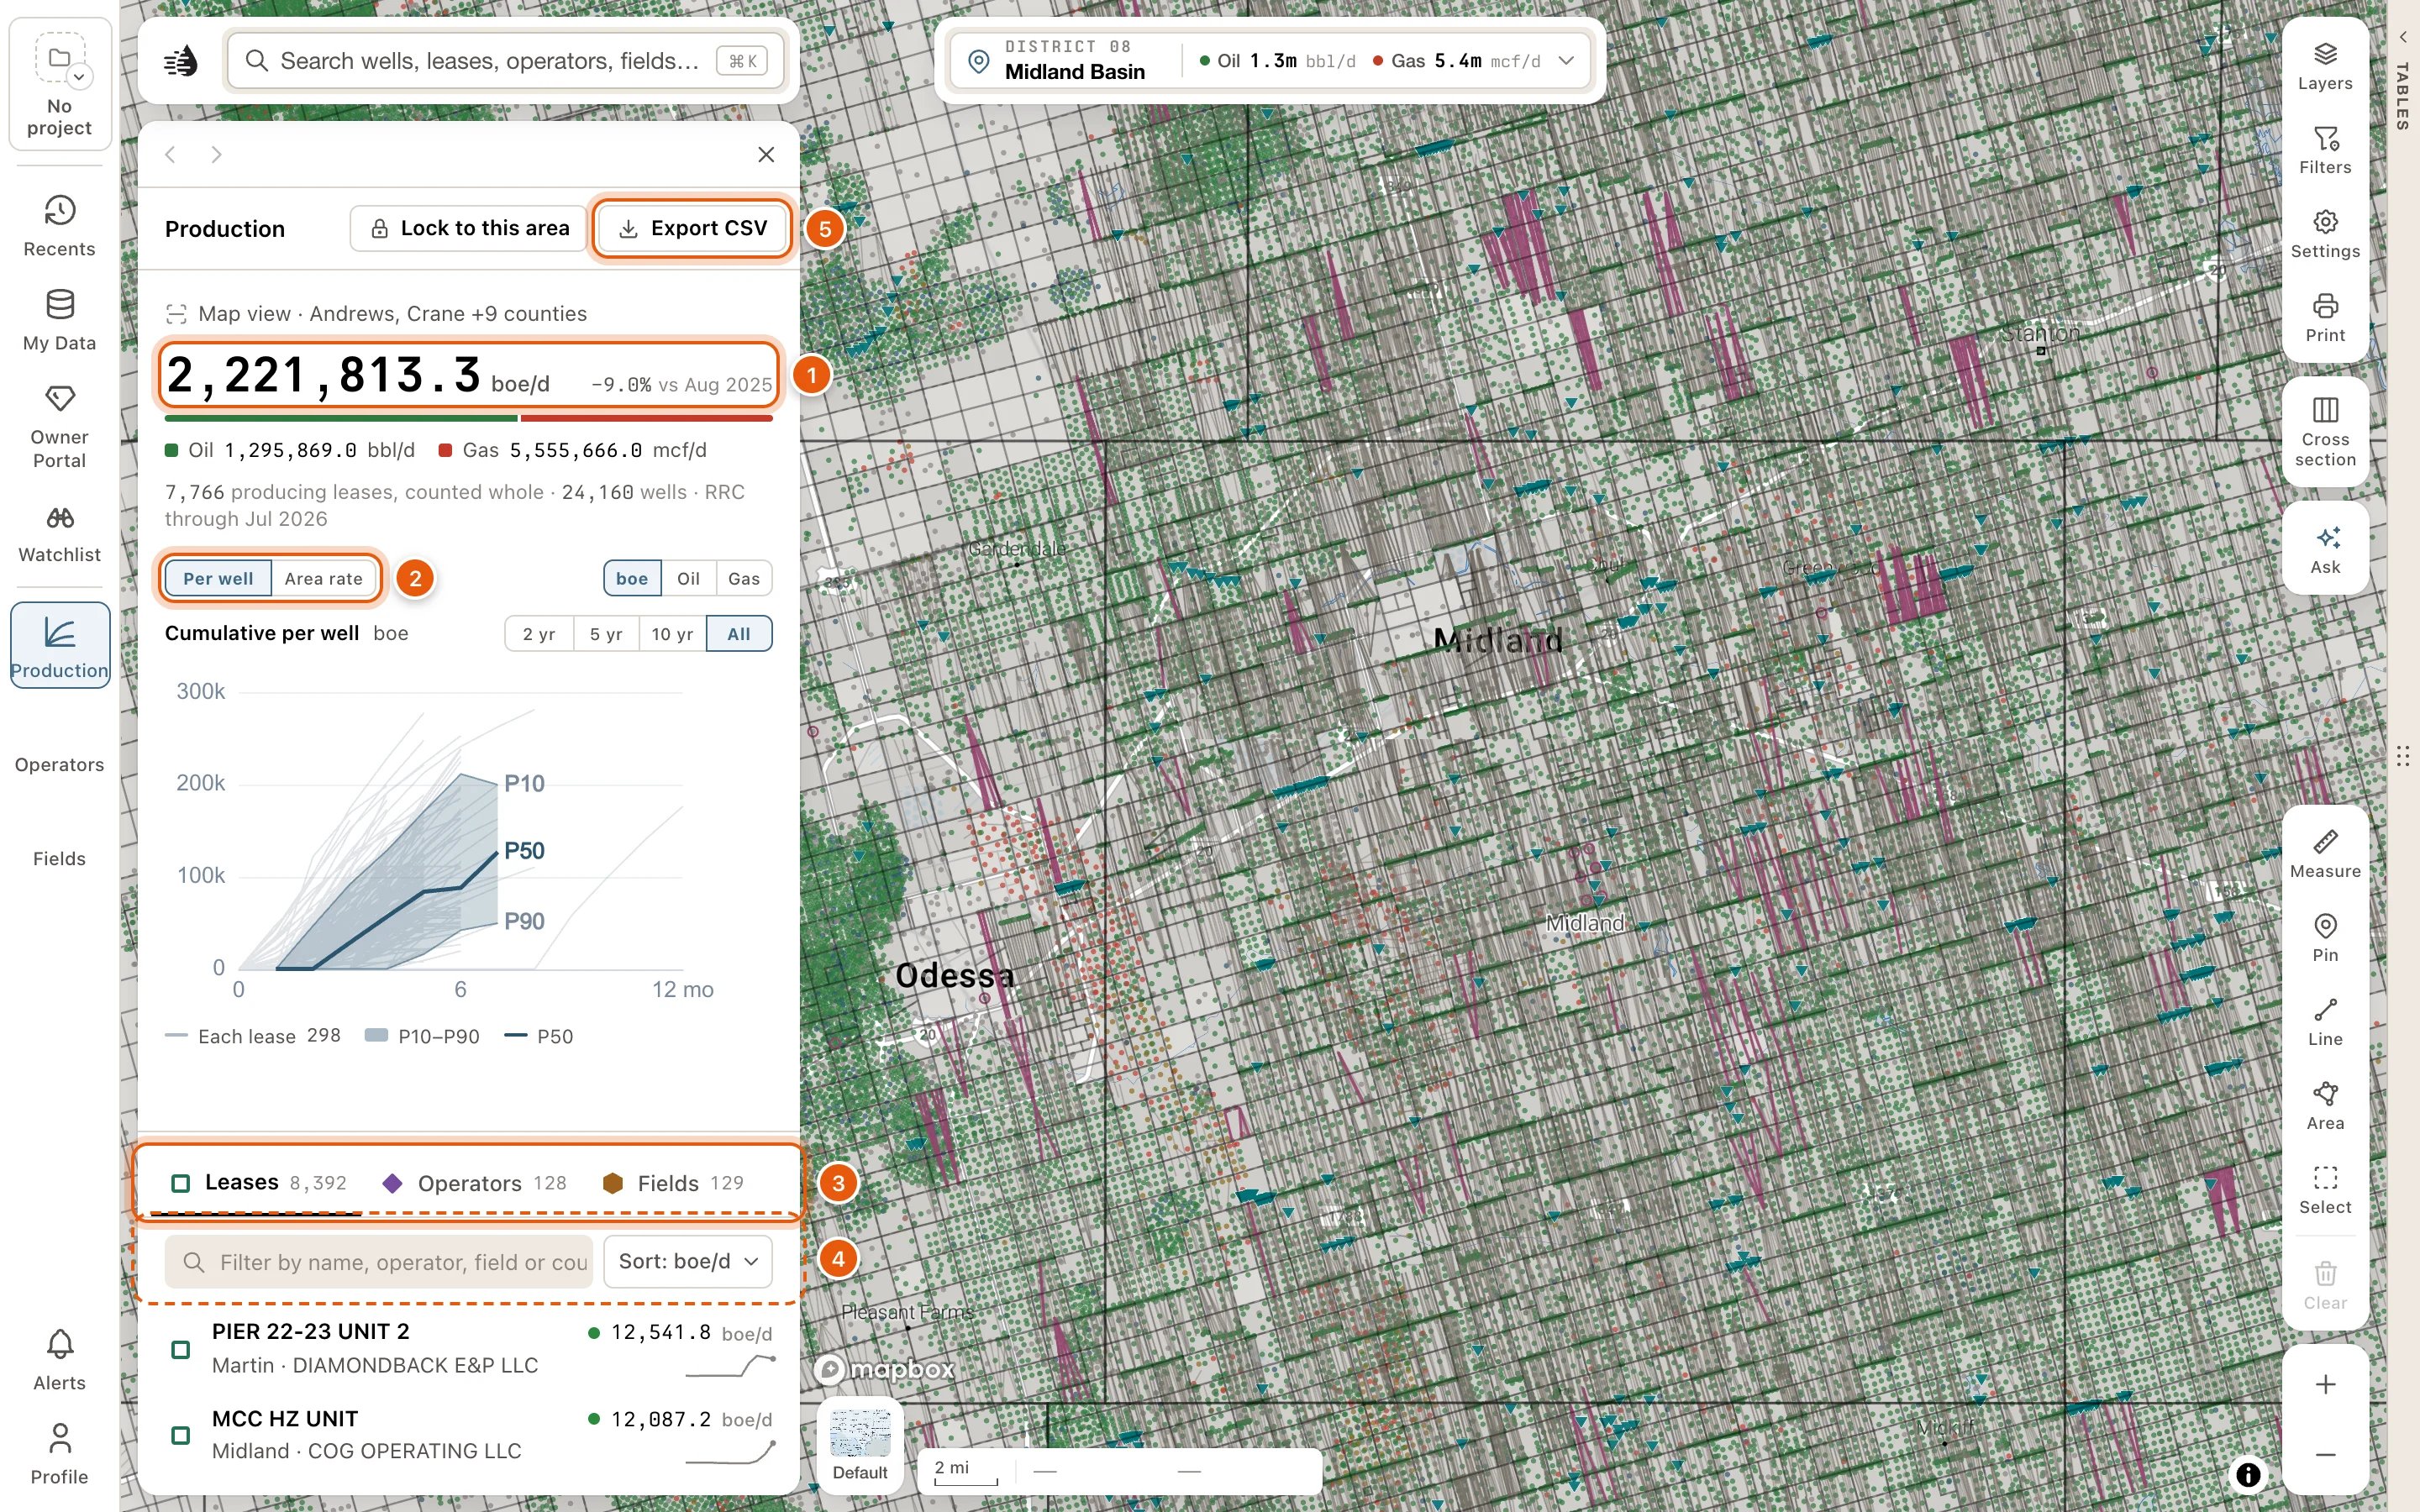
The totals
At the top, a line says what the panel covers, like Map view · Midland County. Under it:- The area’s production in boe/d (oil plus gas, 6 mcf to the barrel), and how much it has changed over the last 12 months, like +4.2% vs Sep 2025.
- How it splits between oil, in bbl/d, and gas, in mcf/d.
- How many producing leases and wells make it, and the latest month the RRC has reported, like 812 producing leases, counted whole · 2,904 wells · RRC through Aug 2026.
The chart
Choose Per well or Area rate, and boe, Oil or Gas.- Per well shows how the wells here perform with age. Texas reports production by lease, so each faint line is one lease’s cumulative production per well, by months online. The shaded band runs from P10 to P90 across the leases, and the solid line is the P50. Choose 2 yr, 5 yr, 10 yr or All for how many months online to show.
- Area rate shows the whole view’s daily rate over the last 12 months. With boe chosen, it draws oil and gas on their own lines. Log or Linear sets the scale.
The rows
Choose Leases, Operators or Fields. Each tab says how many are in view. Each row shows the name, where it is, its rate in boe/d (or Not producing), and its trend over the last 12 months. A lease row also names its operator and field.- Filter by name, operator, field or county narrows the rows. Clear empties it.
- The sort button reads the current sort, like Sort: boe/d. Its menu has Current boe/d, Oil bbl/d, Gas mcf/d, 12-month change, Wells and Cumulative boe.
- Pointing at a lease row outlines the lease on the map.
- Click a row to pin it on the chart. View, on the row you point at or have pinned, or Enter, opens its card. Cards need a paid plan, unless the data tables are open.
- Show N more of M adds more rows.
Lock to this area
To pan around without the numbers changing, click Lock to this area at the top of the panel. It stays pressed while the panel is locked, and the top line reads Locked. Click Lock to this area again, or Unlock beside Locked, to follow the map once more. To add up an area you draw instead of the whole view, use the Select tool. See Select an area.Export the rows as CSV
Export CSV, at the top of the panel, downloads every row on the tab you’re on, not just the rows showing, in the current filter and sort. While the panel is locked, the export covers the locked area.
The 12-month change is a percentage. For exports of wells, leases and production beyond what’s in view, see Export data.
The panel starts fresh each time you open it: on Leases, sorted by boe/d, following the map.