

Turn on the Logs layer
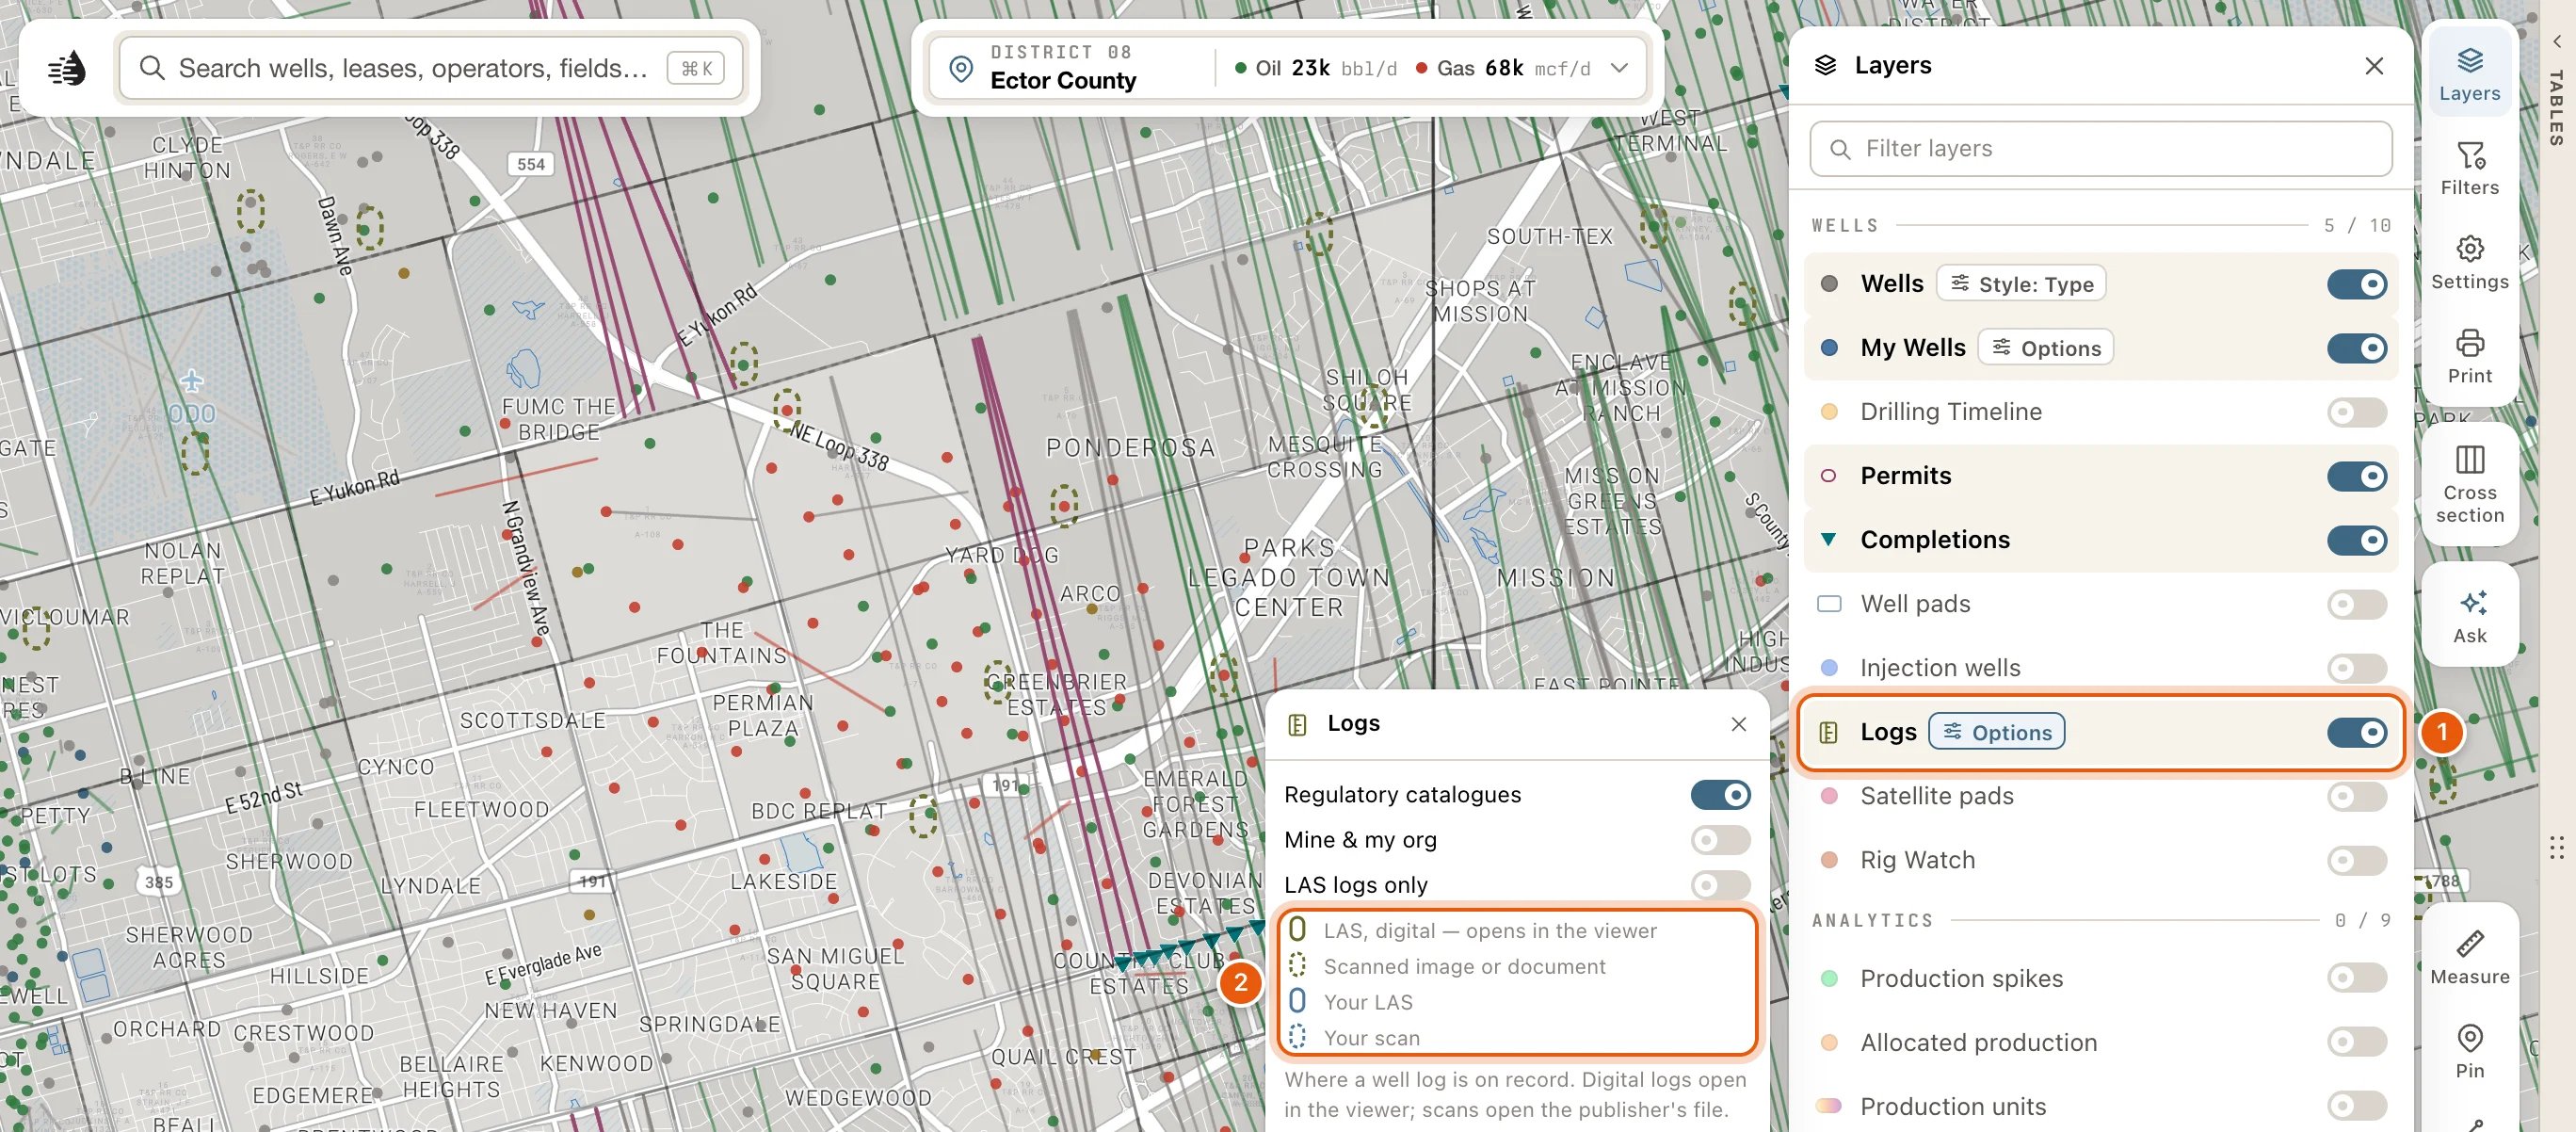
Click Layers on the right side of the map, then turn on Logs in the WELLS group. Each well with a log gets a capsule around its dot. The well’s own dot and symbol still show inside it.
Once the layer is on, Options beside its name opens three switches:
- Regulatory catalogues: the public catalogues’ logs.
- Mine & my org: logs you or your organization uploaded.
- LAS logs only: hides the scans, leaving the digital logs.
Open a well’s log
1
Turn on Logs
Click Layers, then Logs in the WELLS group. Capsules appear around the wells that have a log.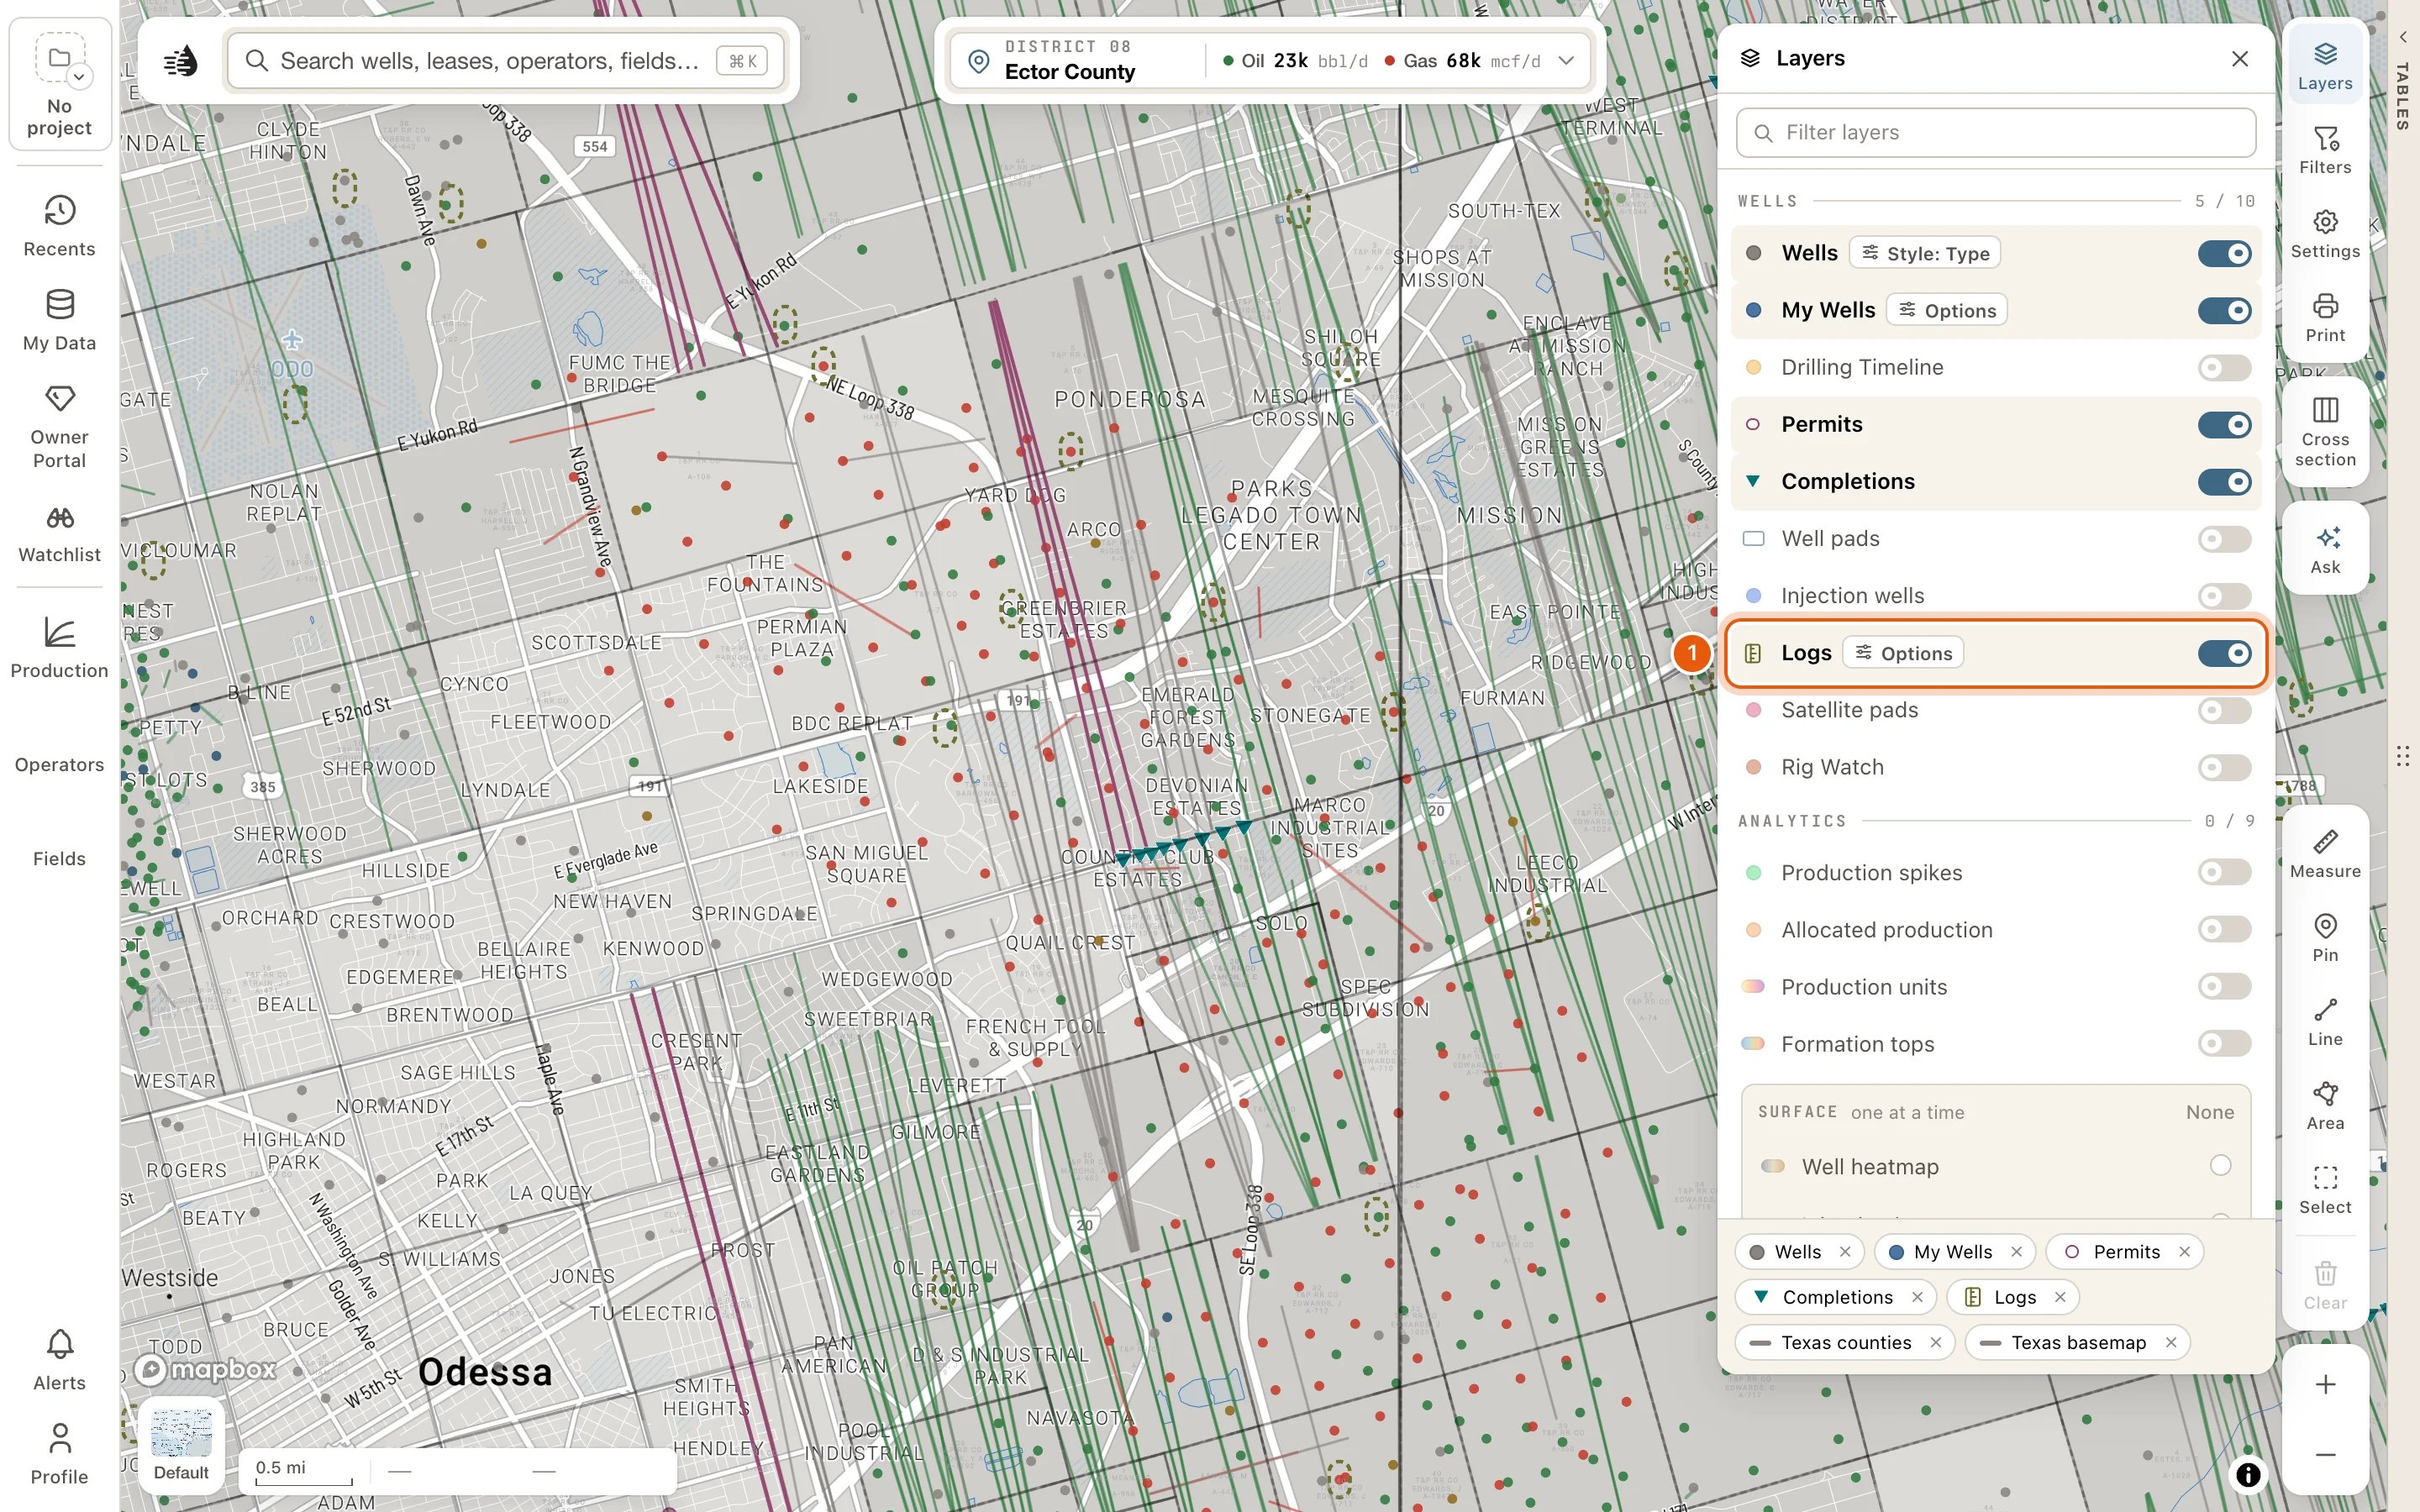
2
Open the well's popup and choose Logs
Zoom in and click the well to open its popup. If you’ve set popups to open on hover, point at it instead. See Map settings.At the bottom of the popup, click More, then Logs.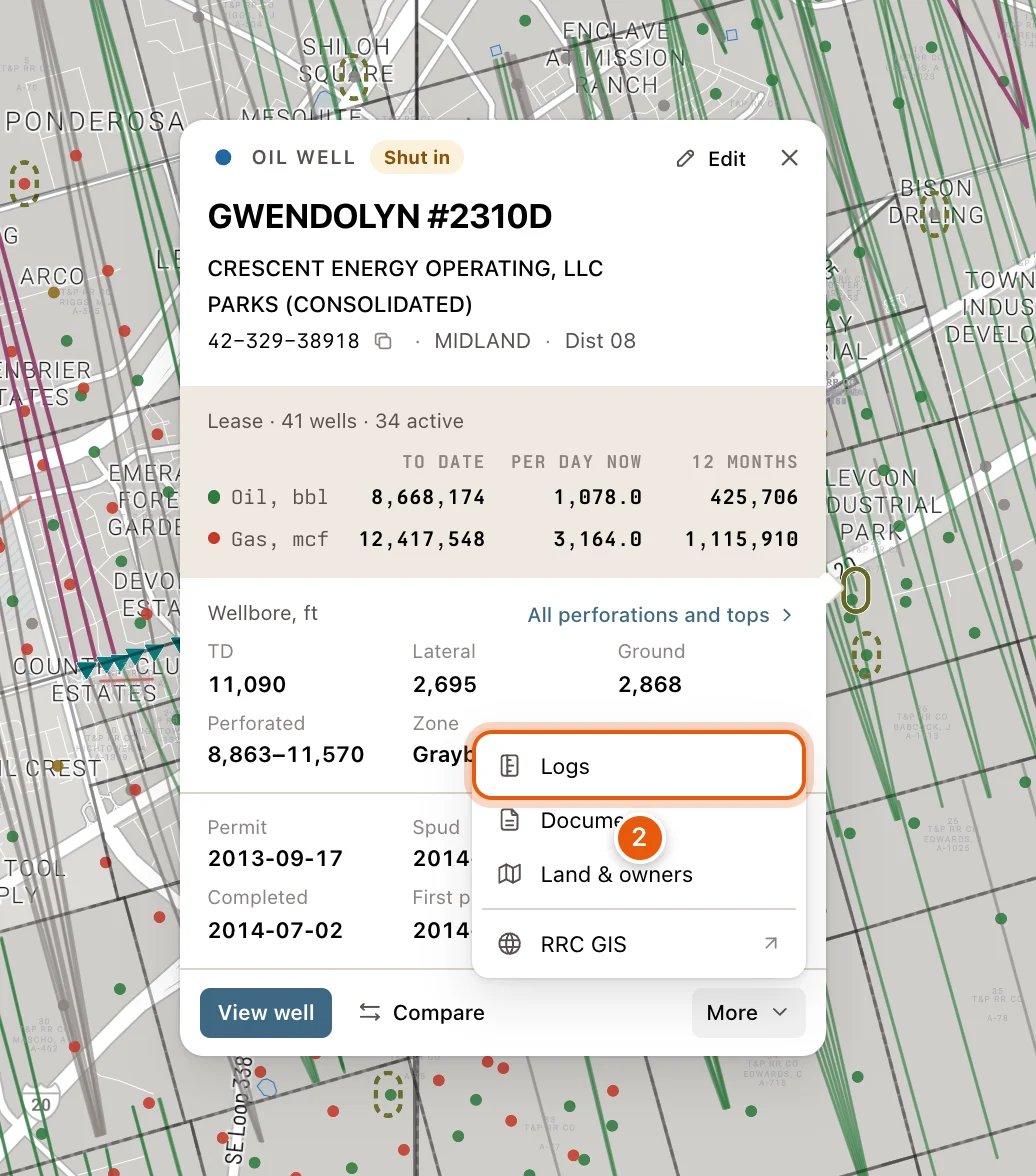
3
Read the log in the Log tab
The data tables open beside the map on a tab named Log, showing the well’s best log. The band at the top names the well. Below it is the log itself: its curves for a LAS, or its scanned sections for a scan.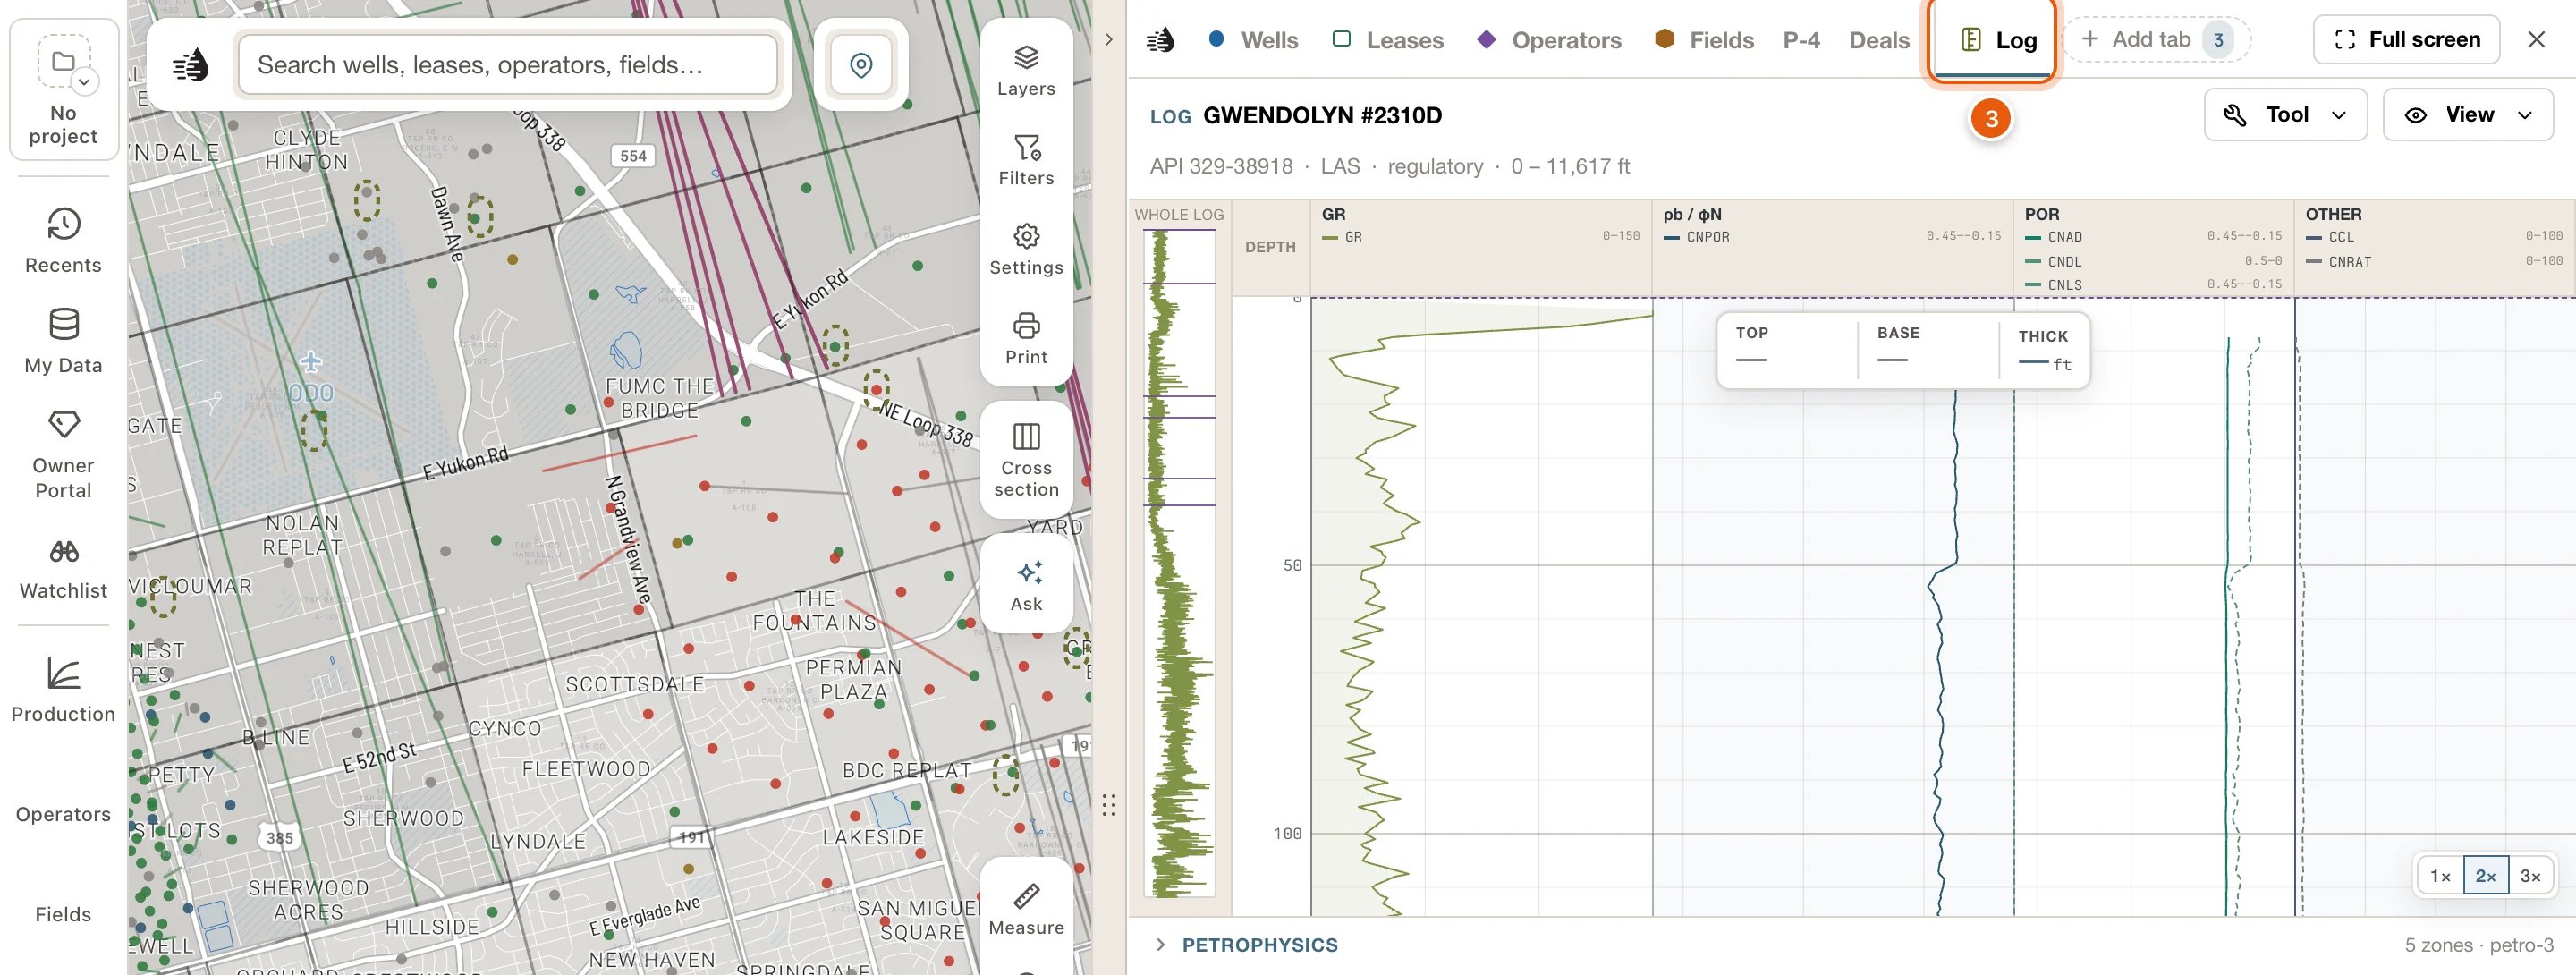
4
Drag down the strip to choose an interval
Press on the strip at the top of the interval you want and drag down to its base. The box over the strip gives its TOP, BASE and THICK, and IN THE INTERVAL, under the strip, gives each curve’s range and average there.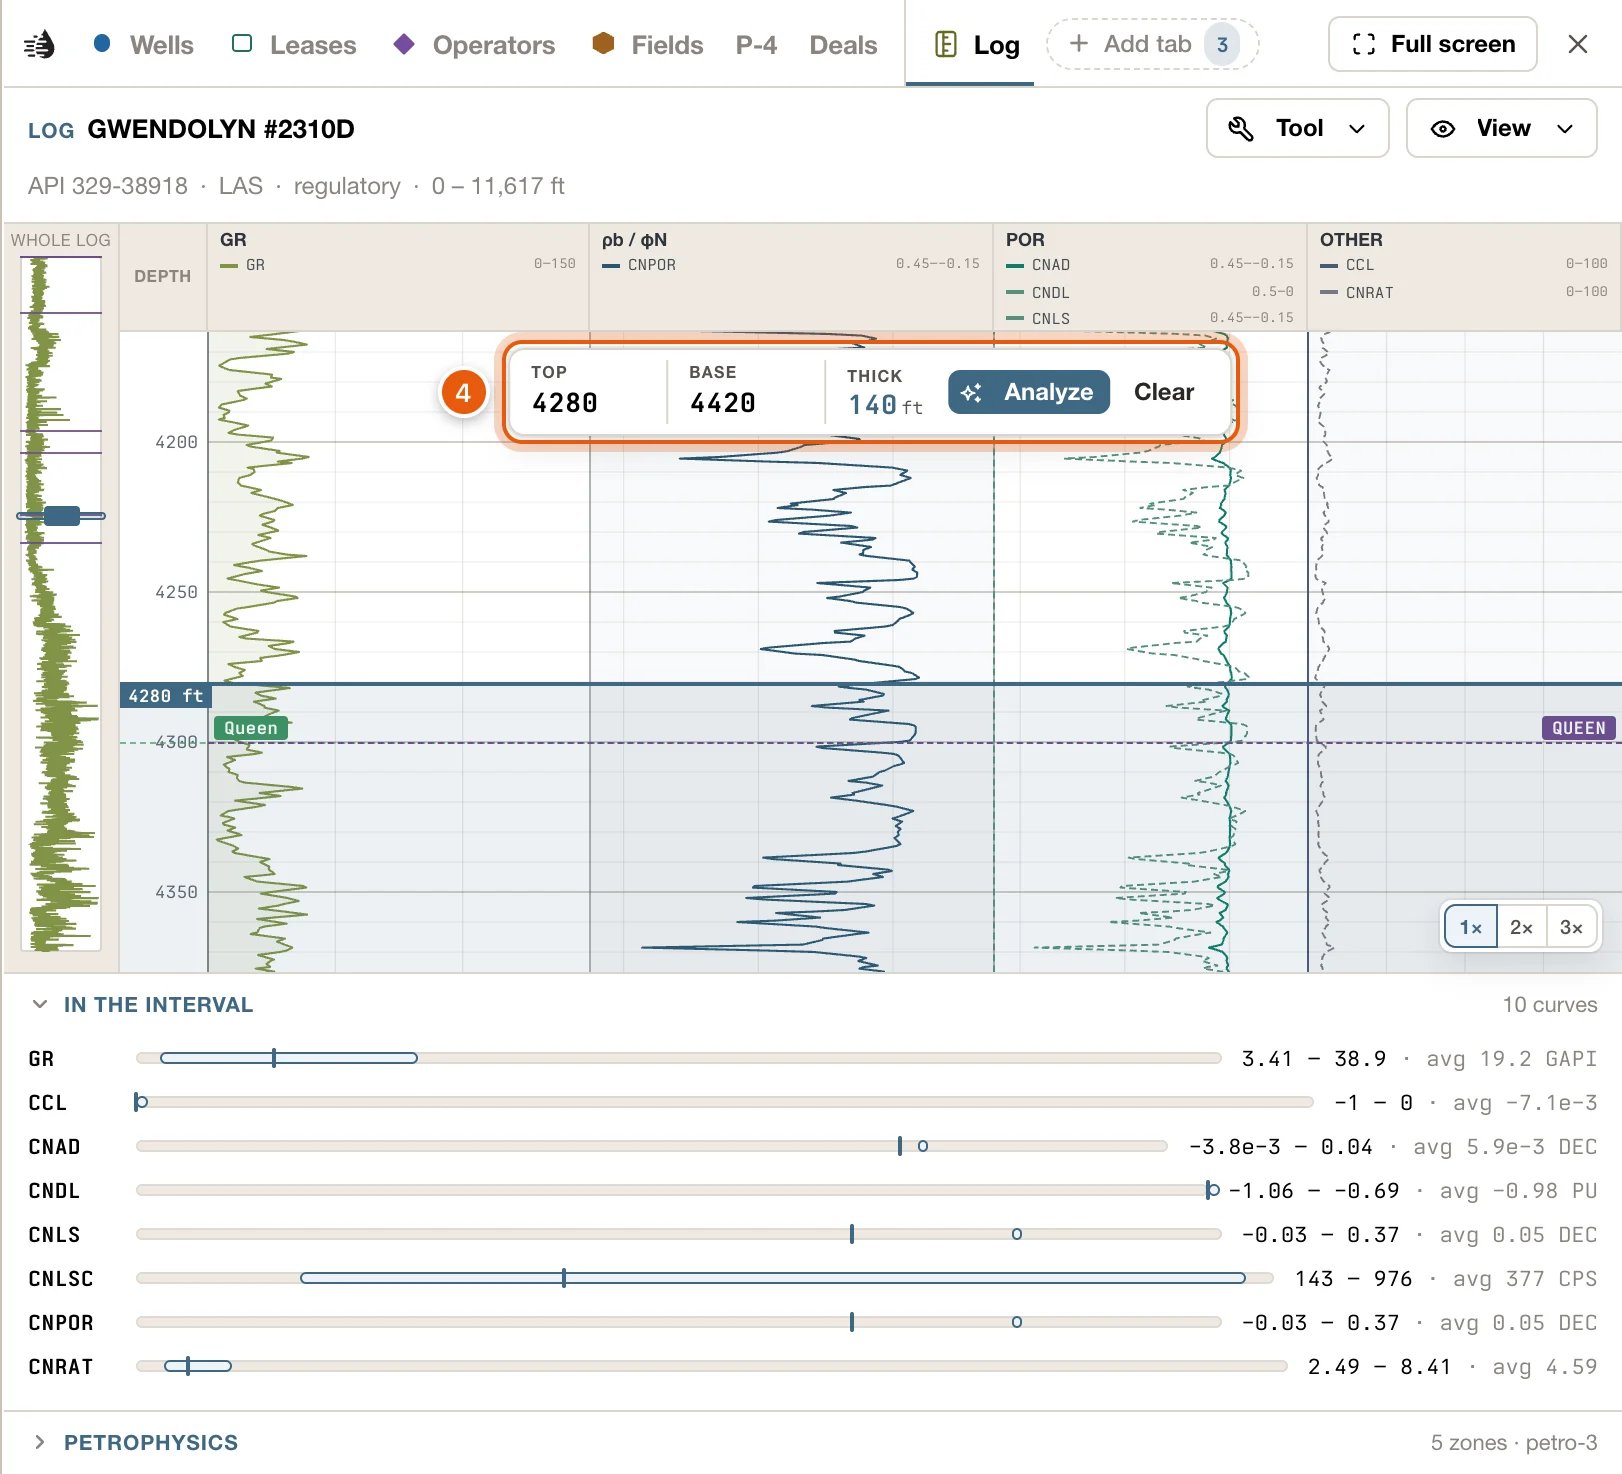
Pointing and clicking on the marks
What a capsule does depends on how close you’re zoomed in.- Zoomed in to zoom 10 or closer, the well under a capsule comes first: it opens its own popup, as any well does. Use More → Logs in the popup to open its log.
- Zoomed out further, or where a log has no well dot under it, the capsule takes over. Pointing at it shows a card with how many logs are on file and their format, the well’s name from zoom 10, and Uploaded by on your own: You or Your organization. Click it to open the log.
- If QuickScout has a copy of the well’s log it can read, the log opens in the Log tab.
- If QuickScout only has a link to the log, such as a scan kept by its publisher, or several wells sit under the pointer, the log drawer opens on the left instead. See The log drawer.
The log drawer
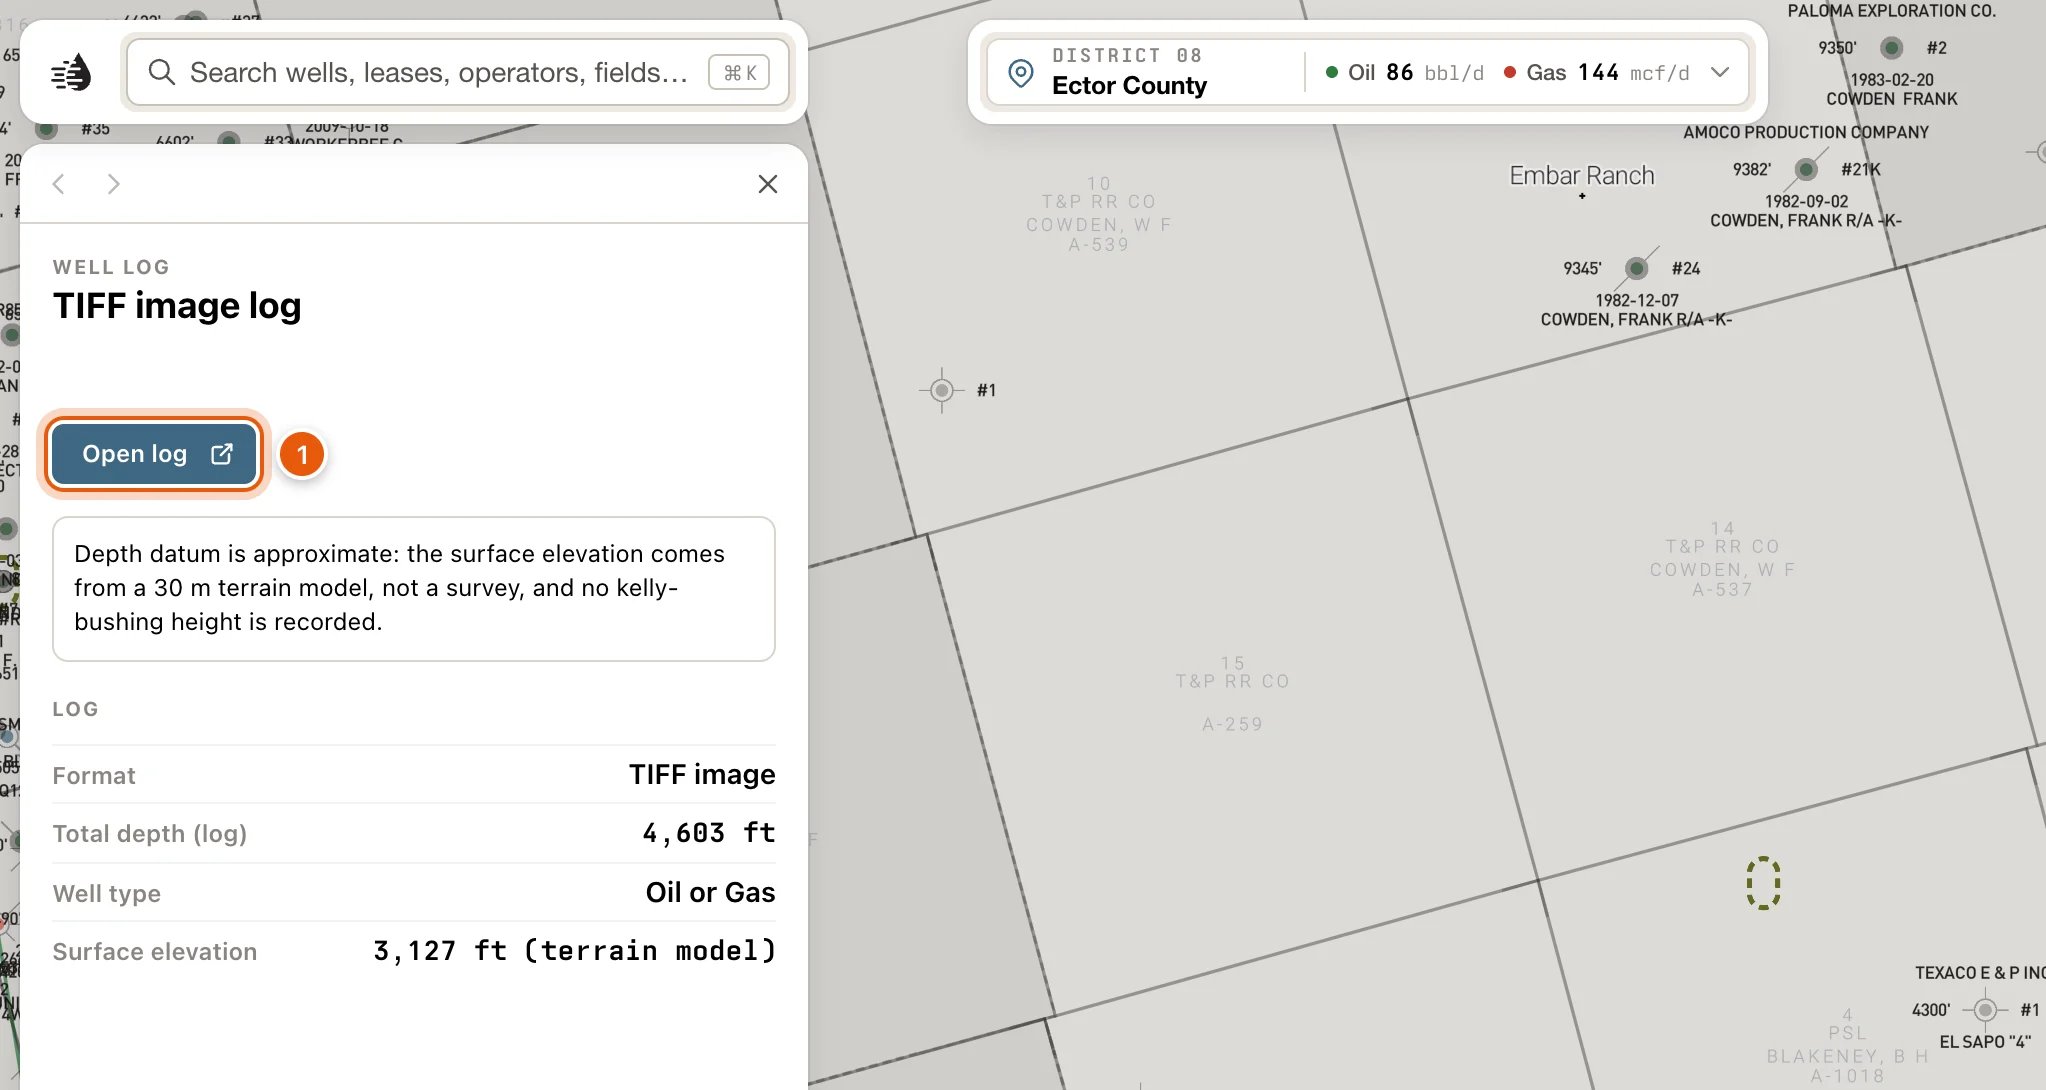
The log drawer describes one log on record, and links to the file where the log is kept. It needs a paid plan. At the top, WELL LOG (or YOUR LOG) and the lease and well number. Under that is the way to open the log:- Open in viewer opens the log in the Log tab.
- Open the scan opens the publisher’s scan of the same log in a new browser tab.
- Open log opens the original file in a new browser tab, where you can save it.
- This log is on record, but there is no copy to open. means there’s nothing to open.
- One more log on this well — the well card lists every one. when the well has others.
- LOGS AT THIS LOCATION, when several wells sit at one spot. Click one to describe it.
- LOG: Format, Logged interval, Total depth (log), Well type, Surface elevation, KB height, and Location for a well outside Texas.
- A note when the depths are on an approximate datum: the elevation came from a terrain model rather than a survey, or no kelly-bushing height is recorded.
- WELL: the well’s API, operator, lease, field, county, total depth and dates. View well opens its card.
On the well card
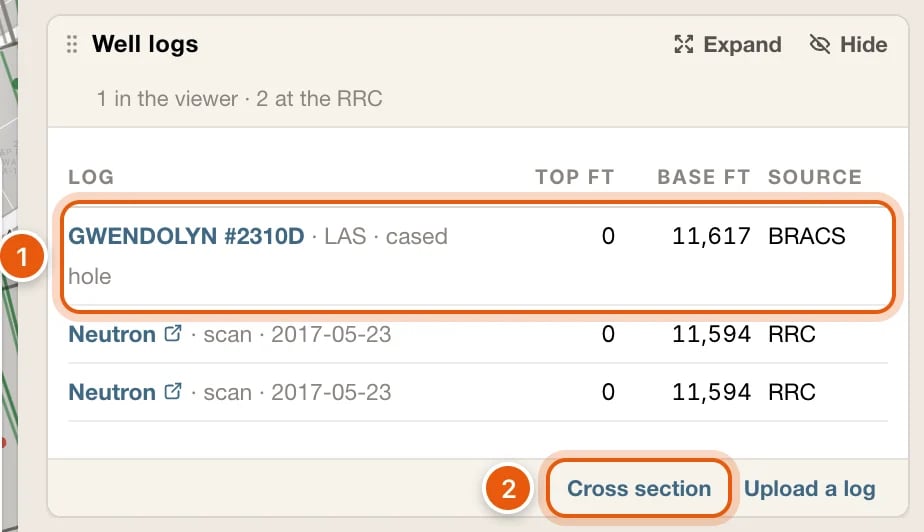
A well’s card lists every log on the well in one table, in its Well logs block. Its header counts them, such as 2 in the viewer · 3 at the RRC.- First come the logs that open in the Log tab: yours, your organization’s, and the regulatory catalogues’ that your plan can open. Digital (LAS) logs come first. Click a row to open that log.
- Then the Railroad Commission’s own index of logs filed on the well, newest first: its scans, and its L-1 statements that a log was run. A row with a link icon after its name opens the Commission’s scans of the well on its site, in a new tab. The others have nothing to open.
- The columns: LOG (the log’s name, then what it is, such as LAS · cased hole or scan · 2021-10-05), TOP FT, BASE FT and SOURCE (Yours, the catalogue, or RRC).
- Cross section puts the well at the end of your map cross-section. It stays pressed while the well is in the section, and clicking it again takes the well out. To see the section, click Cross section on the right side of the map.
- Upload a log adds a LAS file or a scanned log to this well. When it’s ready, it opens in the Log tab.
- Sign in to see this well’s logs.
- None of your own on file. The regulatory catalogues need a paid plan.
- No logs on file for this well.
- The regulatory catalogues need a paid plan; these are your own and the Commission’s., under the table.
The Log tab
The Log tab sits on the tab row with your tables, and doesn’t change your other tabs or their filters. Click any other tab to go back to it; the log stays on the row, one click away. The tab isn’t saved with your tables. Opening another log replaces the one that’s there, and the tab is gone the next time you load Maps.The band
- The first line: LOG and the well’s name. The Tool and View menus sit at its right end.
- The second line: the API, LAS or Scan, regulatory or yours, the logged depths, and the file’s name.
- When the well has more than one log, a list at the right switches between them. Each choice reads like LAS · 8,120 – 9,340 ft · regulatory.
Read the strip
A LAS log draws its curves in tracks: gamma ray and SP, resistivity, density and neutron, and the rest. The narrow strip at the left draws one curve down the whole log, so you can see where you are.- The chips at the bottom right (1×, 2×, 3×) stretch the strip.
- A scan shows its sections, placed at their depths. Prev and Next step through them.
- A log traced from a scan rather than a LAS file carries a warning, Digitized data — verify before relying on it, under the strip.
Choose an interval
- Drag down the strip, or type depths into TOP and BASE in the box over the strip. THICK is the interval’s thickness.
- Drag the edges of the shaded interval to adjust it. Clear lets it go.
- IN THE INTERVAL, under the strip, lists each curve: where its low and high sit on the curve’s scale, and the figures, such as 45.2 – 118 · avg 87.4. Click the heading to fold it away.
Pick tops and intervals
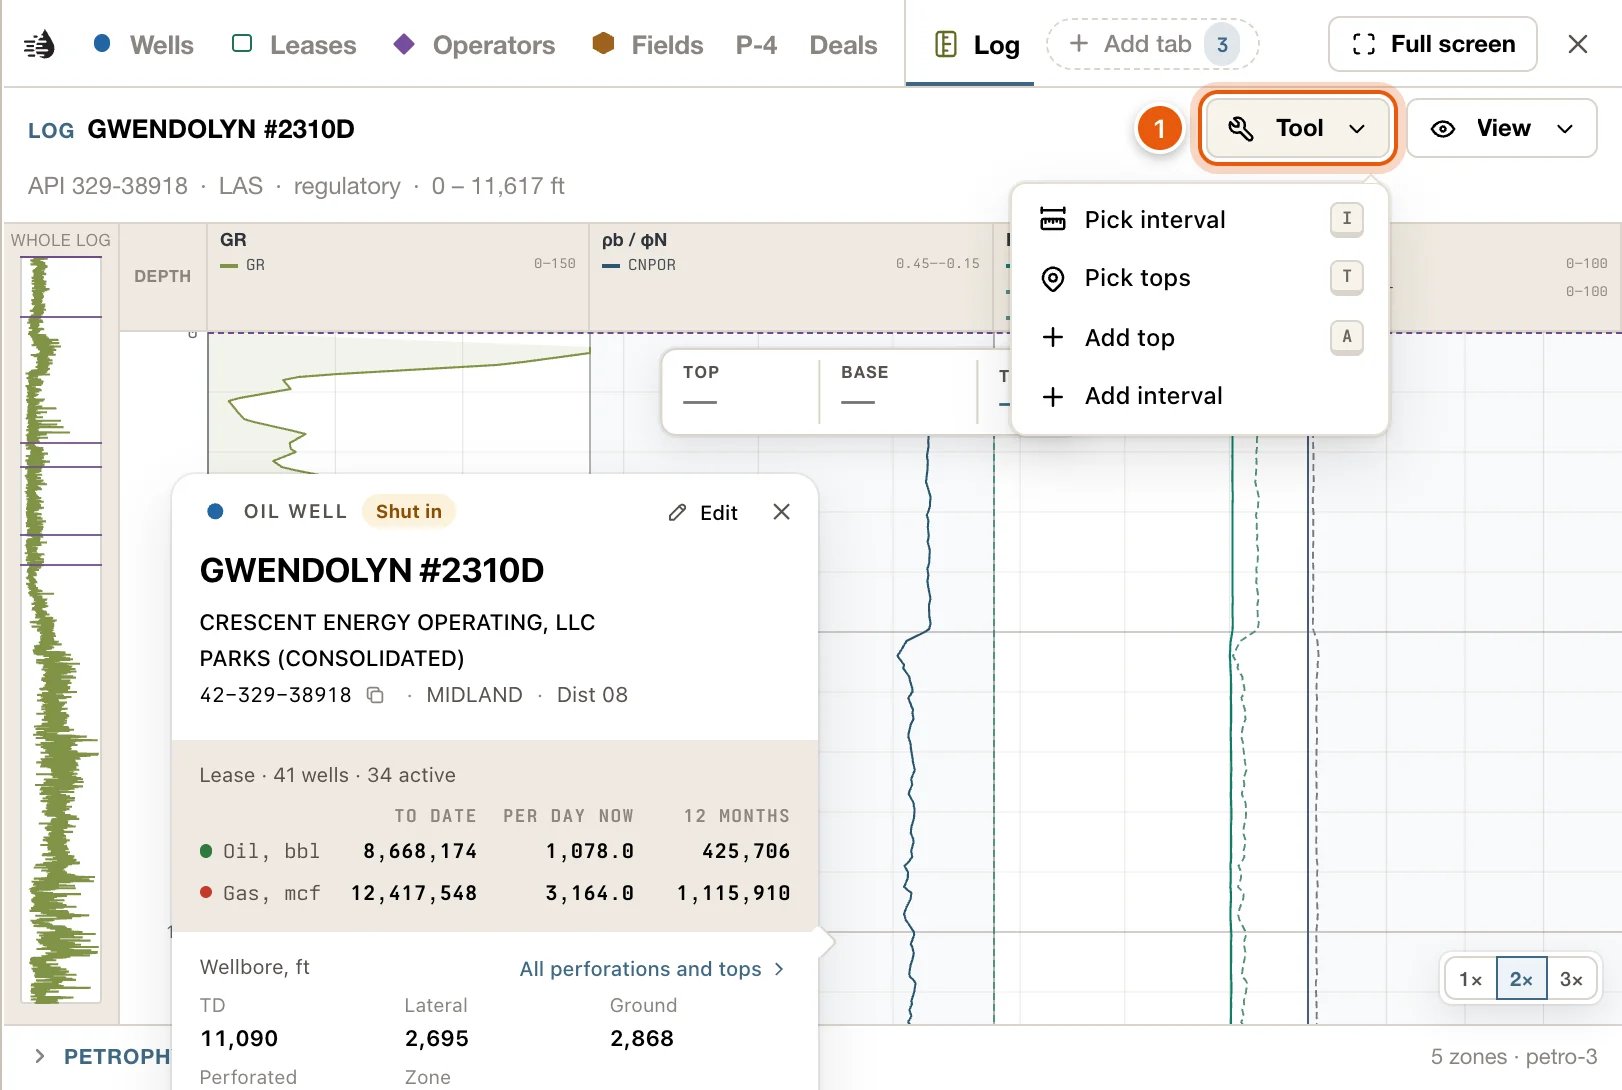
Open Tool for:
While a tool is on, the Tool button names it. Choose it again, or press its key, to turn it off.
The tops you pick here are the well’s tops, not just this log’s. They show on the well’s card, on the Formation tops layer and in the cross-section, and your organization sees them. Drag one of your own tops to move it, or click it to change or delete it.
The View menu
- Curves and Scan switch between a log’s curves and its scan, when it has both.
- Whole-log curve picks the curve the narrow strip at the left draws. Auto (gamma / first) is the default.
- Scale gridlines turns the tracks’ gridlines on and off.
- RRC MARKERS · MD FT: Perforations, Casing shoes and Formations from the RRC’s filings, drawn on the strip at their depths.
- Each track has its own switch, and a box for each of its curves.
- Reset to auto puts the tracks and curves back.
Well records on the strip
The well’s records that have a depth are marked at their depths along the strip’s right edge: drill-stem tests, cores, tests, shows, notes, perforations, casing strings and the rest. Point at one for its details. See Well records.Asking about a log
With a paid plan, the space beside the strip is a chat about the log. Ask about it in plain English. The chat knows the interval you’ve chosen: Analyze, in the interval box, asks it about the interval’s lithology, porosity, fluids, shows and net pay. Depths in its answers are links that move the strip there. Asking uses credits, as Ask on the map does. Without a paid plan, the space says Asking about a log needs a paid plan. The curves and the sections read as they are.Regulatory logs in the viewer
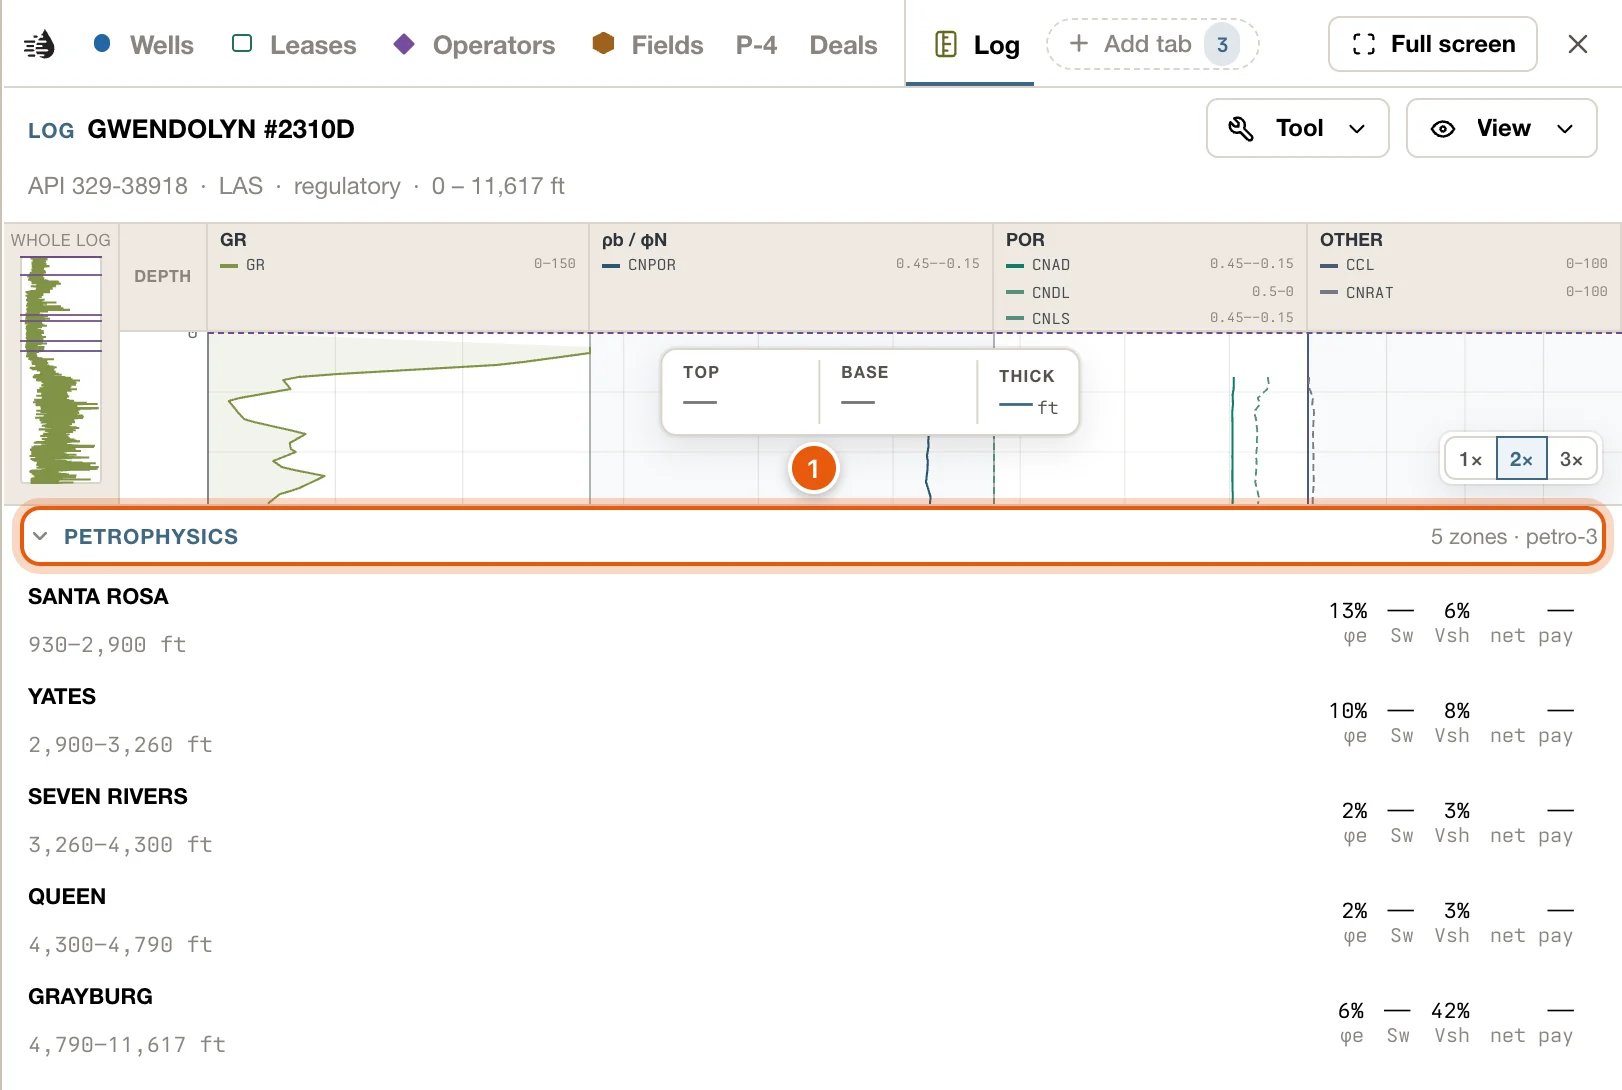
With a paid plan, the regulatory catalogues’ digital (LAS) logs open in the Log tab, the same as your own. Without one, the tab says The regulatory log catalogues need a paid plan. Under the strip of a well with one of these logs, PETROPHYSICS works out each zone the log covers. It starts folded; click its heading to open it.- Each zone gives its depths and four figures: φe (effective porosity), Sw (water saturation), Vsh (shale volume) and net pay.
- Rw low beside a zone means the formation-water resistivity behind its water saturation is a low-confidence estimate.
- Click a zone to move the interval to it.
- A last line names any bypassed pay, pay the well’s perforations may have missed, such as Bypassed pay: 7,412–7,440 ft · 28 ft · φe 12% · Sw 38%.
Troubleshooting
A capsule opens the well's popup, not the log
A capsule opens the well's popup, not the log
From zoom 10, the well under a capsule comes first. In its popup, click More, then Logs. If Logs is greyed out, QuickScout has no log on file for the well.
Clicking a capsule opens the drawer instead of the Log tab
Clicking a capsule opens the drawer instead of the Log tab
QuickScout has no readable copy of that log, only a link to it, or several wells were under the pointer. Use Open log to see the original file, or pick the well under LOGS AT THIS LOCATION.
This log isn’t released yet
This log isn’t released yet
The log is in a regulatory catalogue but isn’t open to read in QuickScout yet. This log is no longer available. means a log that was uploaded has since been removed.
No curves or depth-registered sections to display
No curves or depth-registered sections to display
The log has no digital curves, and its scan hasn’t been placed at depth. Use Open log in the log drawer to see the original.
The Log tab is still there after I've finished
The Log tab is still there after I've finished
The tab stays on the tab row while you work in your other tabs. Click any other tab to put it aside. It isn’t saved, so it’s gone the next time you load Maps.