1
Open the Operators panel
Click Operators on the left rail. The panel opens on the left of the map and lists the operators in view, biggest producers first.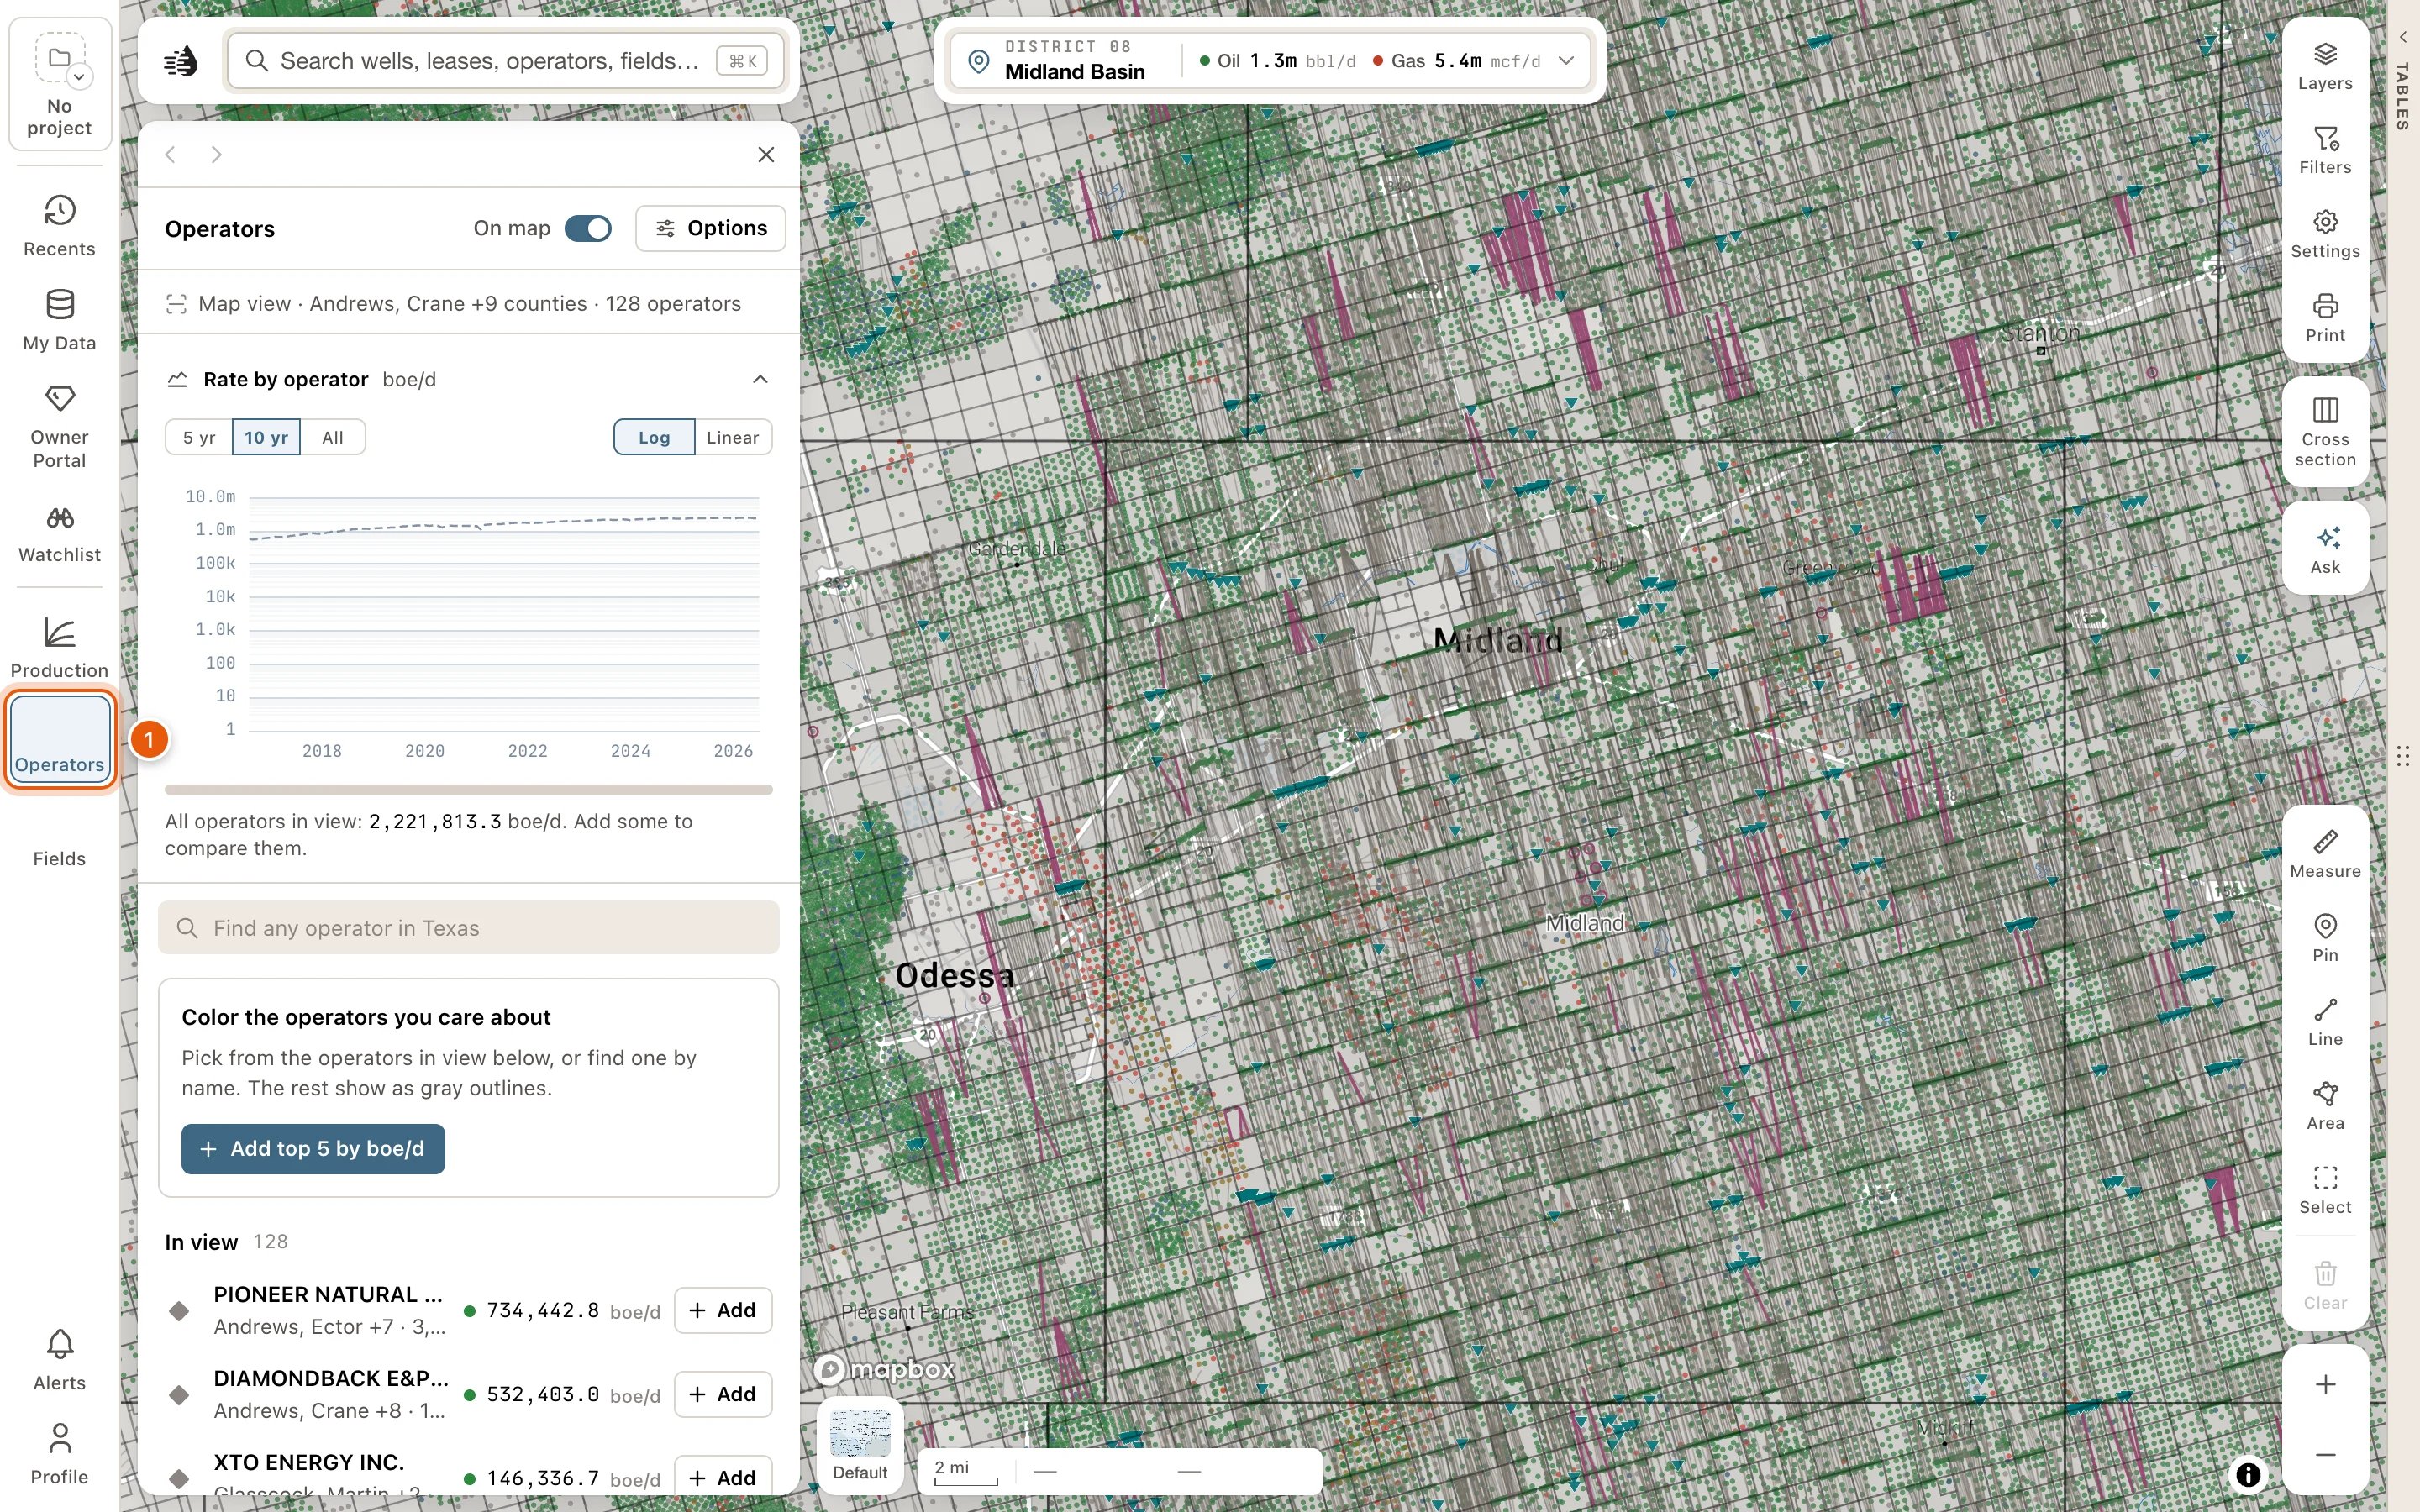
2
Put operators on the map
Click Add top 5 by boe/d for the five biggest. To add one at a time, click Add on an operator’s row under In view. To find one anywhere in Texas, type its name in Find any operator in Texas.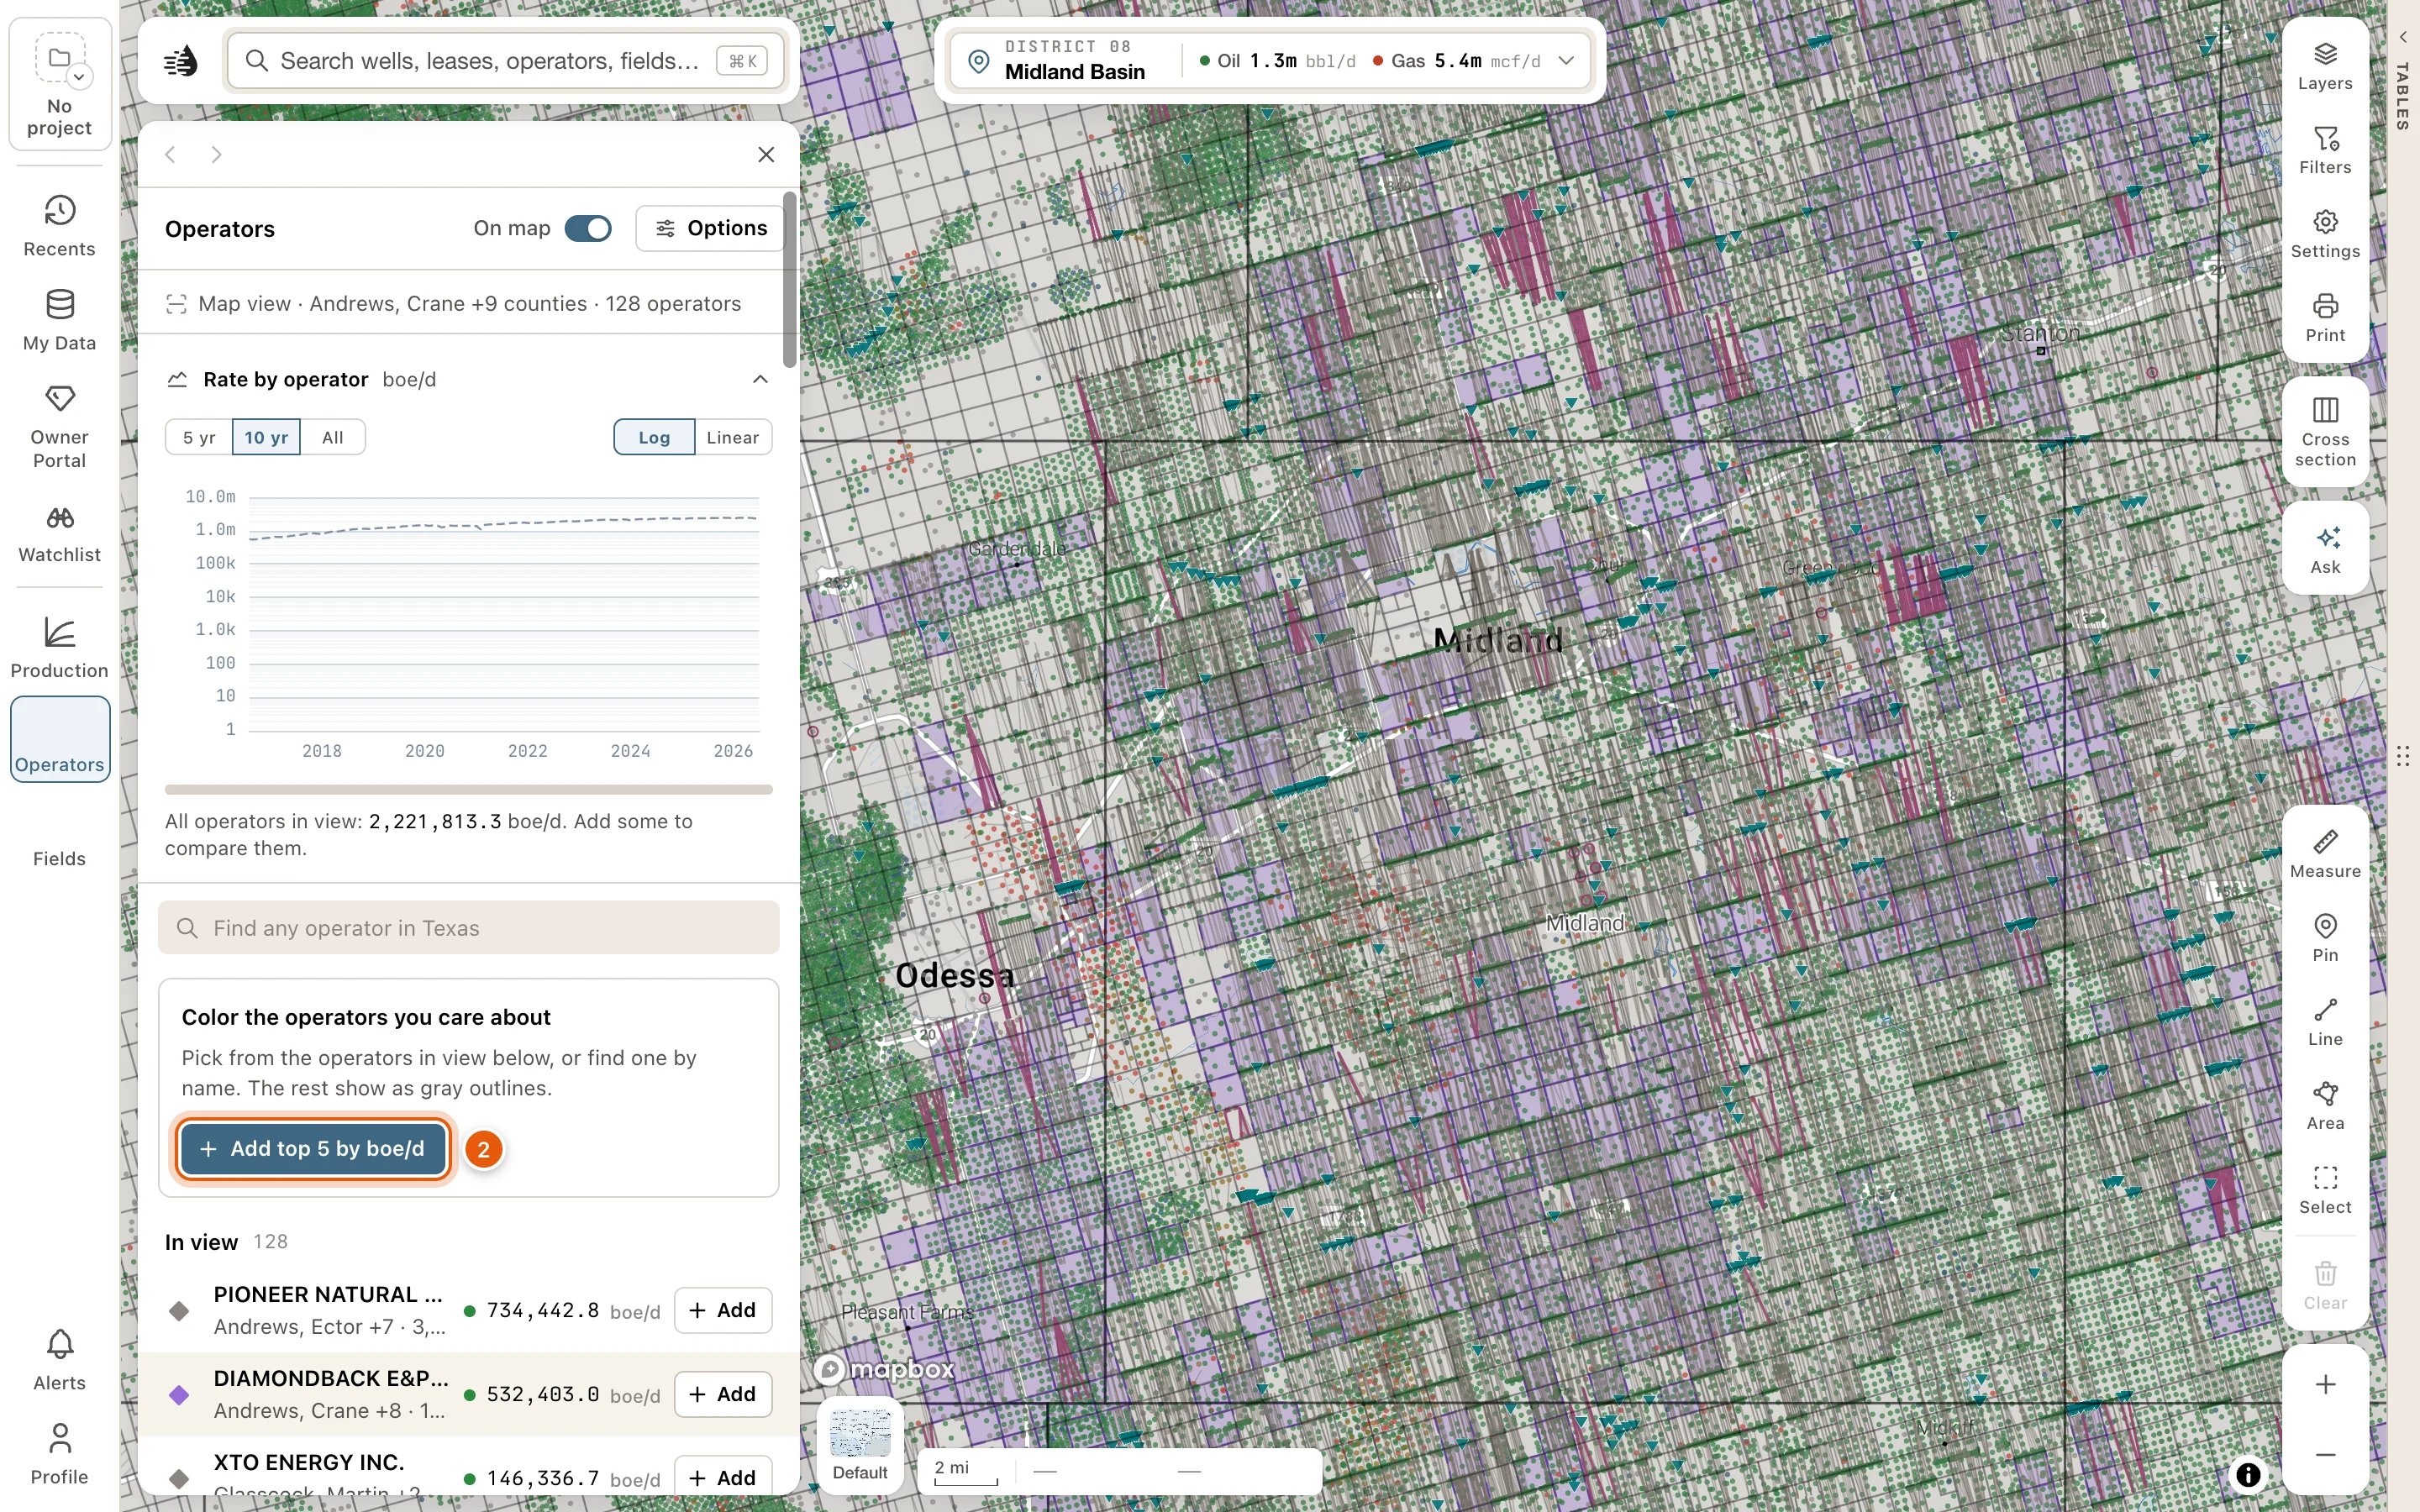
3
Choose a color
Each operator takes the next of ten colors. To change one, click the colored mark beside its name and pick another.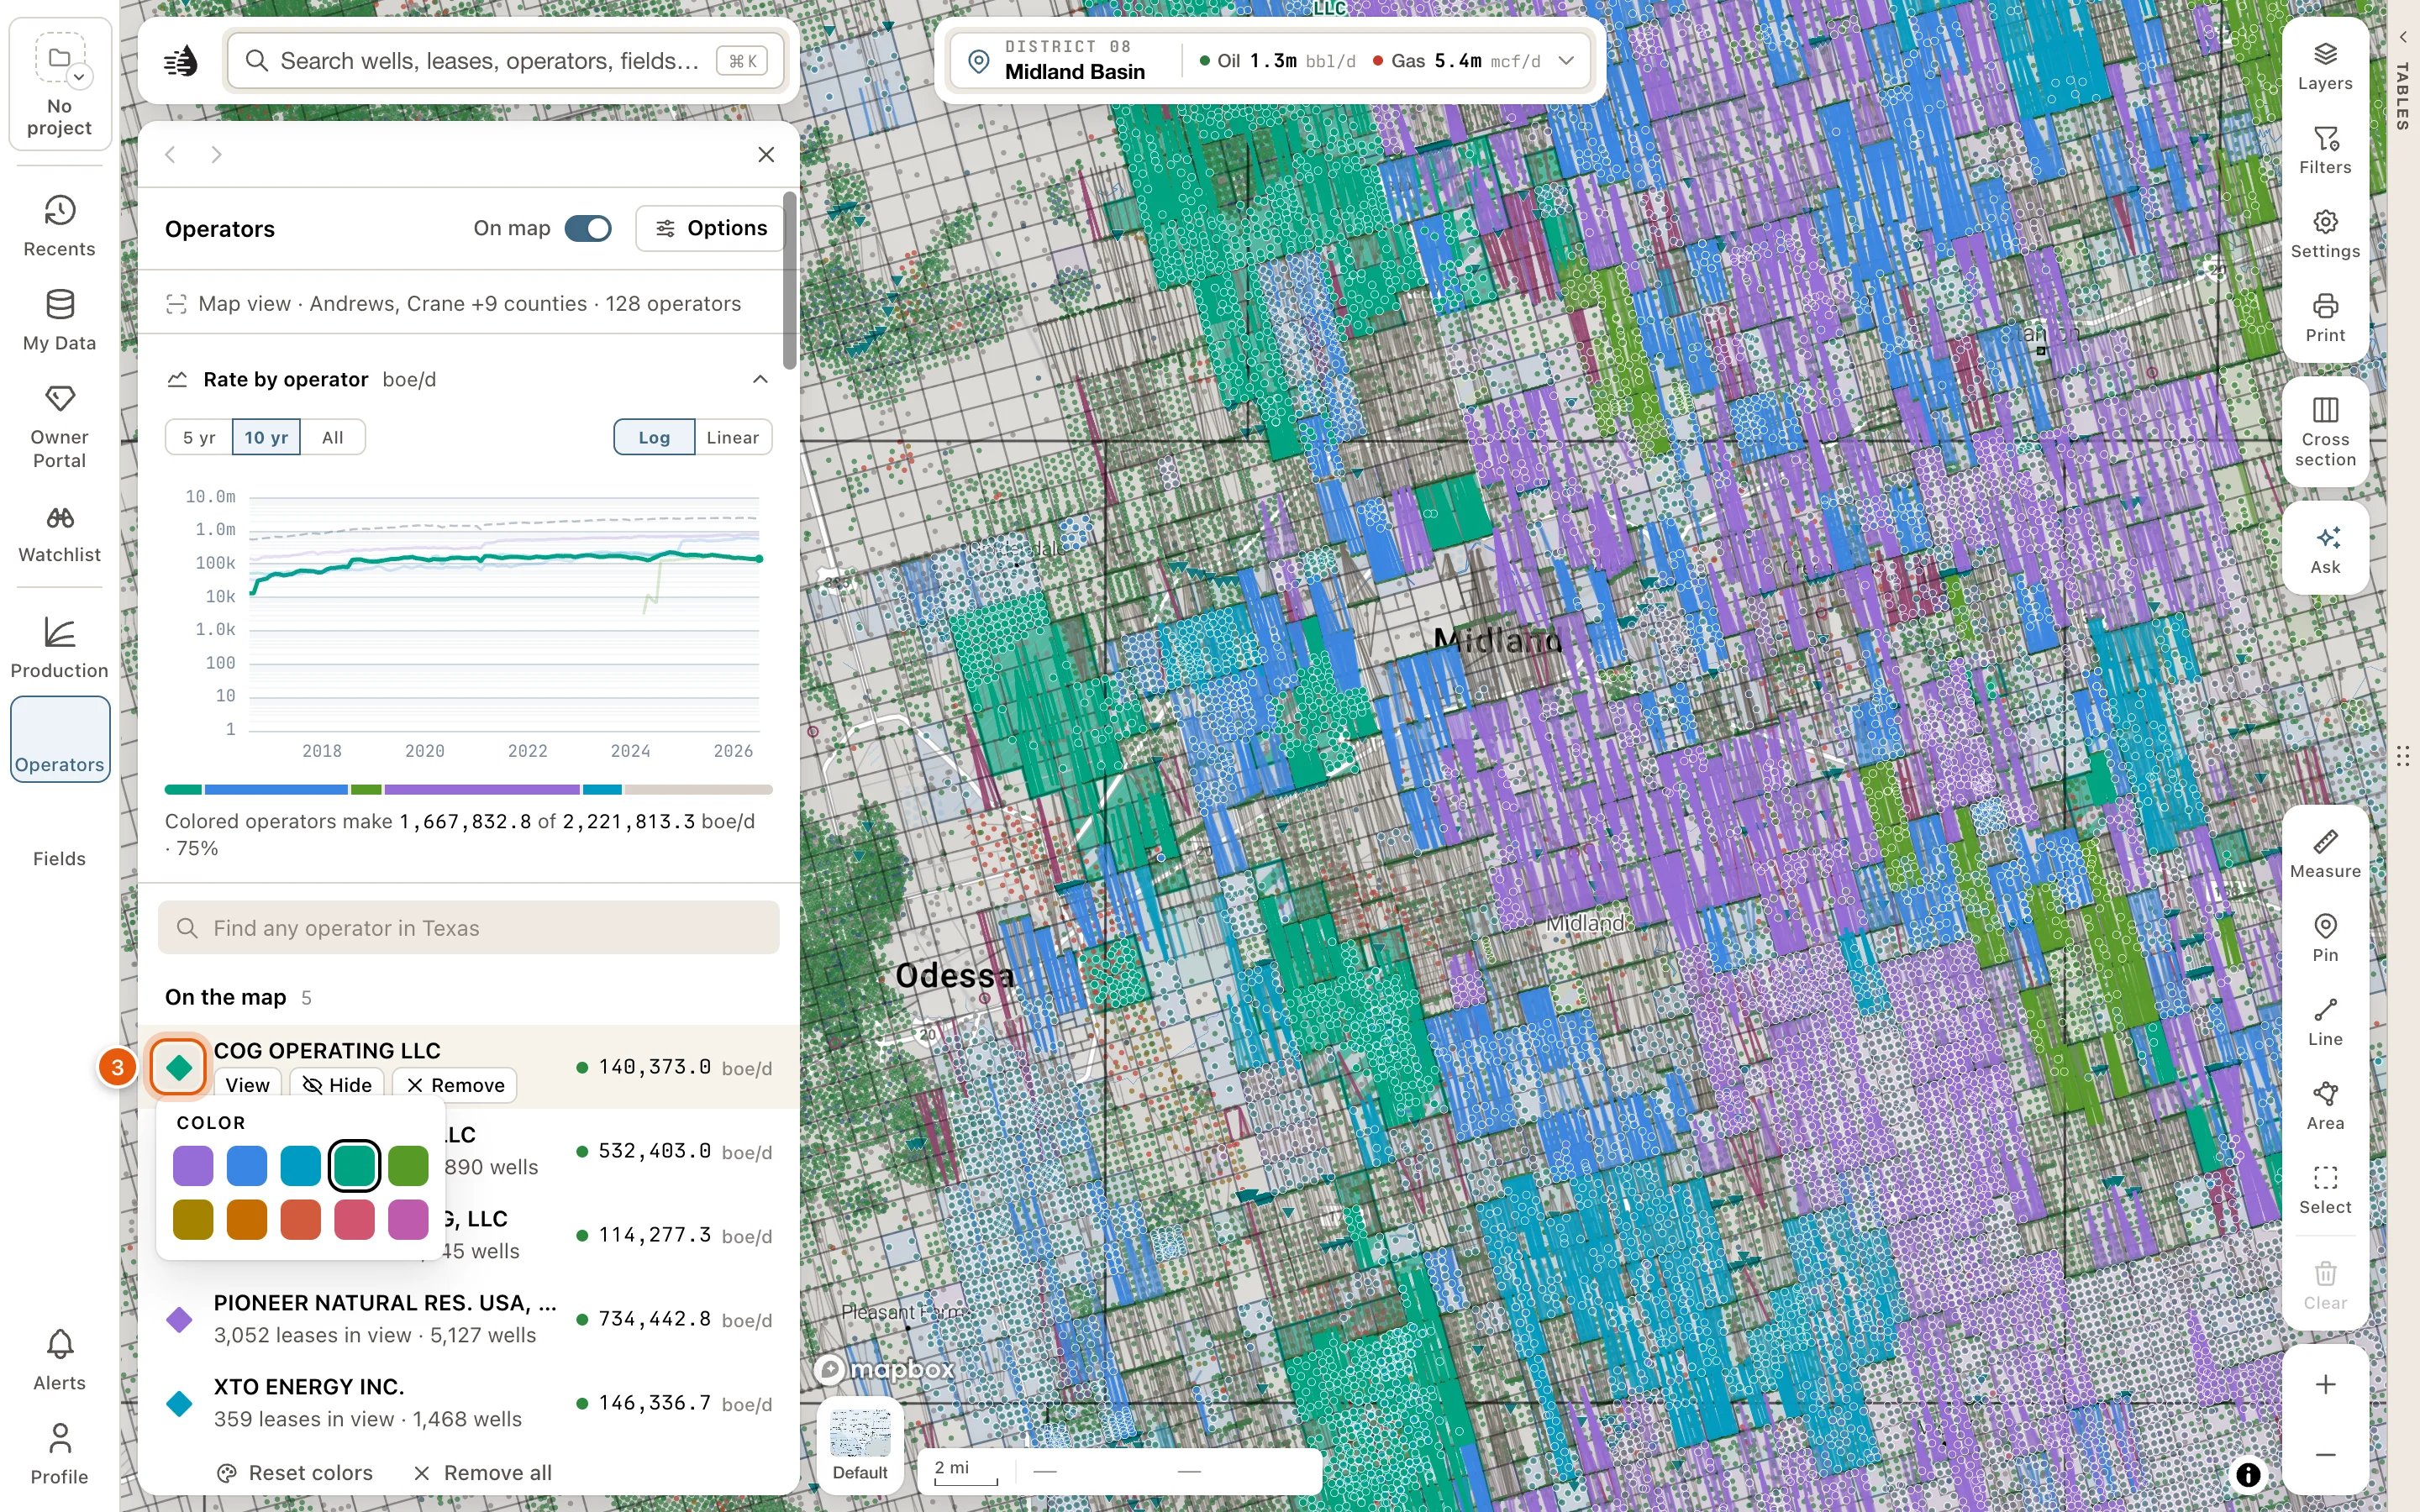
4
Read the map and the chart
On the map, each operator’s leasehold and wells are drawn in its color. Rate by operator, above the list, draws each operator’s production in view as a line, beside a dashed line for everything in view. The bar under it shows each one’s share of the area’s boe/d. Point at a row to bring its line forward and pick it out on the map.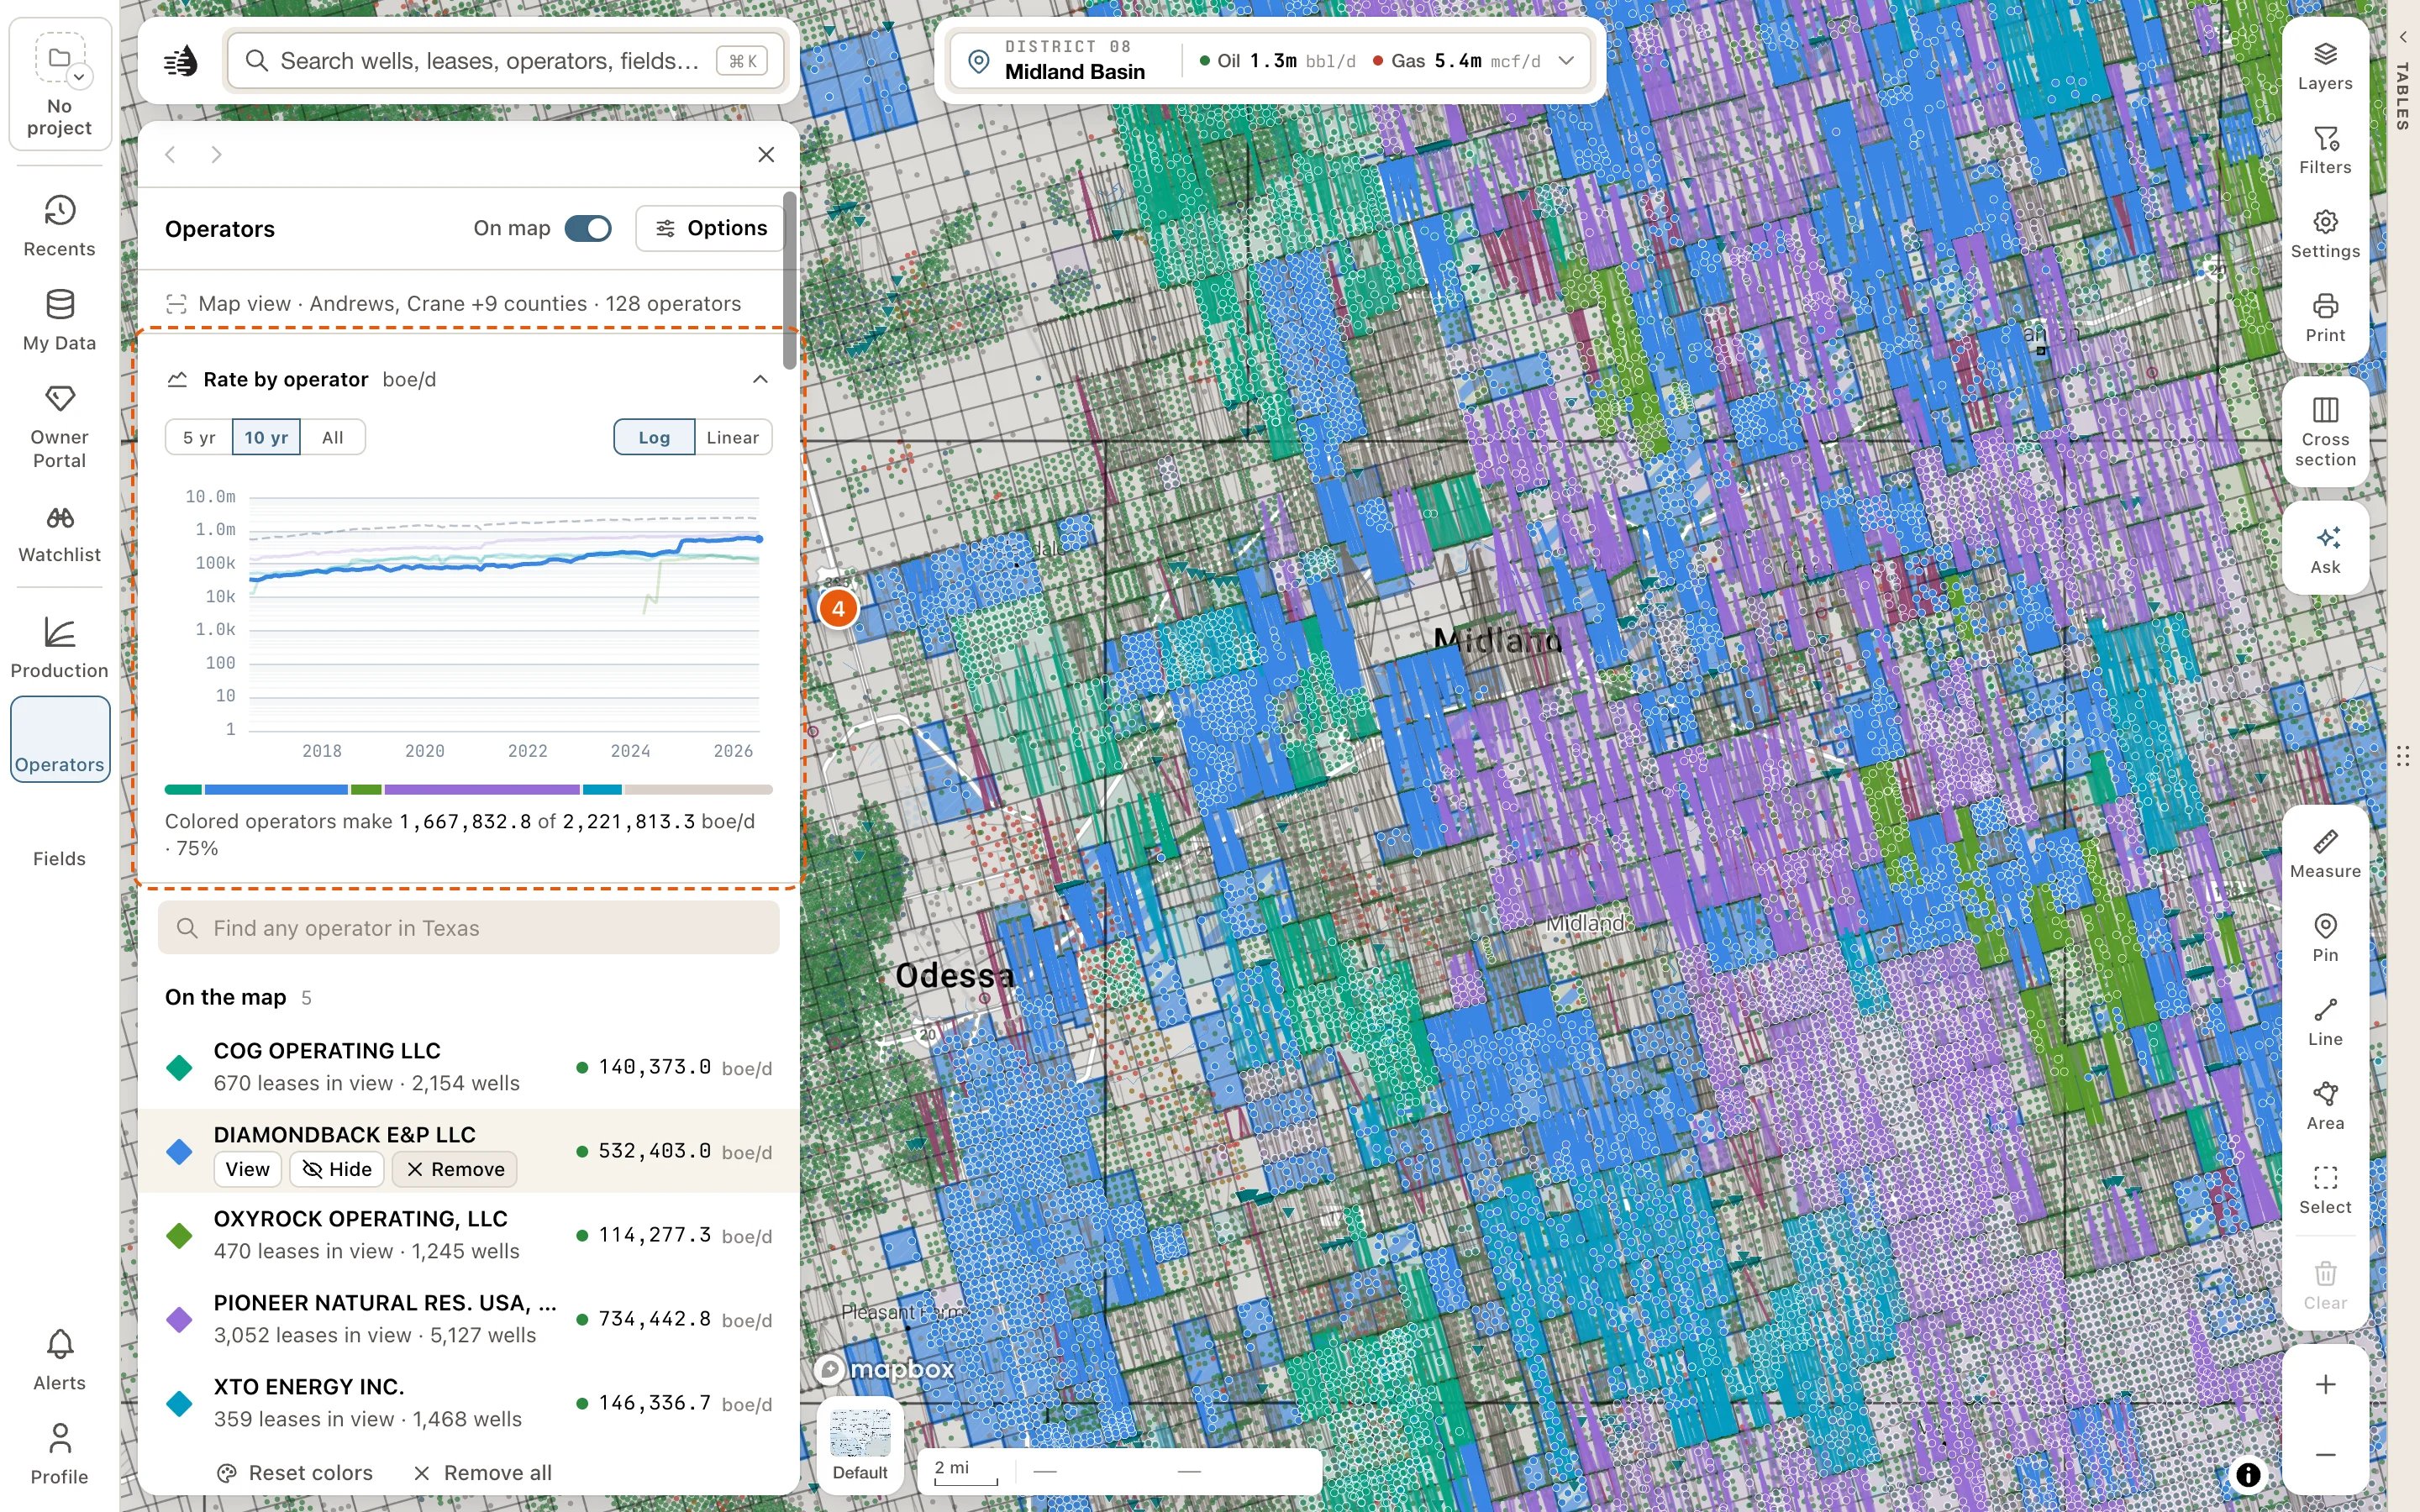
The panel
At the top:- On map switches the whole layer on or off and keeps your picks. While it’s off, a line below the lists reads The layer is off. Nothing is drawn. Click Turn on to put it back.
- Options opens a card of switches for the layer.
- Under the title, a line says what’s in view, like Map view · Midland County · 186 operators.
- Rate by operator (or Rate by field): choose 5 yr, 10 yr or All, and Log or Linear. Click the chart’s heading to fold it away, and again to open it.
- On the map: the operators you’ve added, from A to Z, each with what it holds in view and its boe/d. Point at a row, or click it, for View (its card), Hide and Remove. Hide takes it off the map but keeps it in the list: the button stays pressed and the row reads Hidden. Click Hide again to draw it. After a remove, Undo brings it back for a few seconds. Click a row to keep it picked out on the map and the chart.
- Under the list, Reset colors gives your picks fresh colors, in order, and Remove all takes every pick off the map. Undo brings them back.
- In view: everyone else in view, ranked by boe/d, each with Add. Pointing at a row previews it on the map in the color it would get. Once you’ve added some, Add top 5 adds the next five biggest. Show N more of M lists more.
- The find box searches all of Texas. Matches In view come first, then Across Texas, each with how far away it is, like 12 mi NW. Enter adds the top match, and Clear empties the box.
- How operator polygons are drawn (How field polygons are drawn on the Fields panel), at the bottom, explains the colored areas.
How the areas are drawn
- An operator’s area is its leasehold: the Texas original land survey tracts that hold an active well the operator controls. Its wells are drawn in the same color. Where two of your operators hold wells on the same tract, the tract is striped in both colors.
- A field’s area is the survey tracts that hold a well producing from that RRC field.
- Click a colored area on the map to open that operator’s or field’s card.
Fields
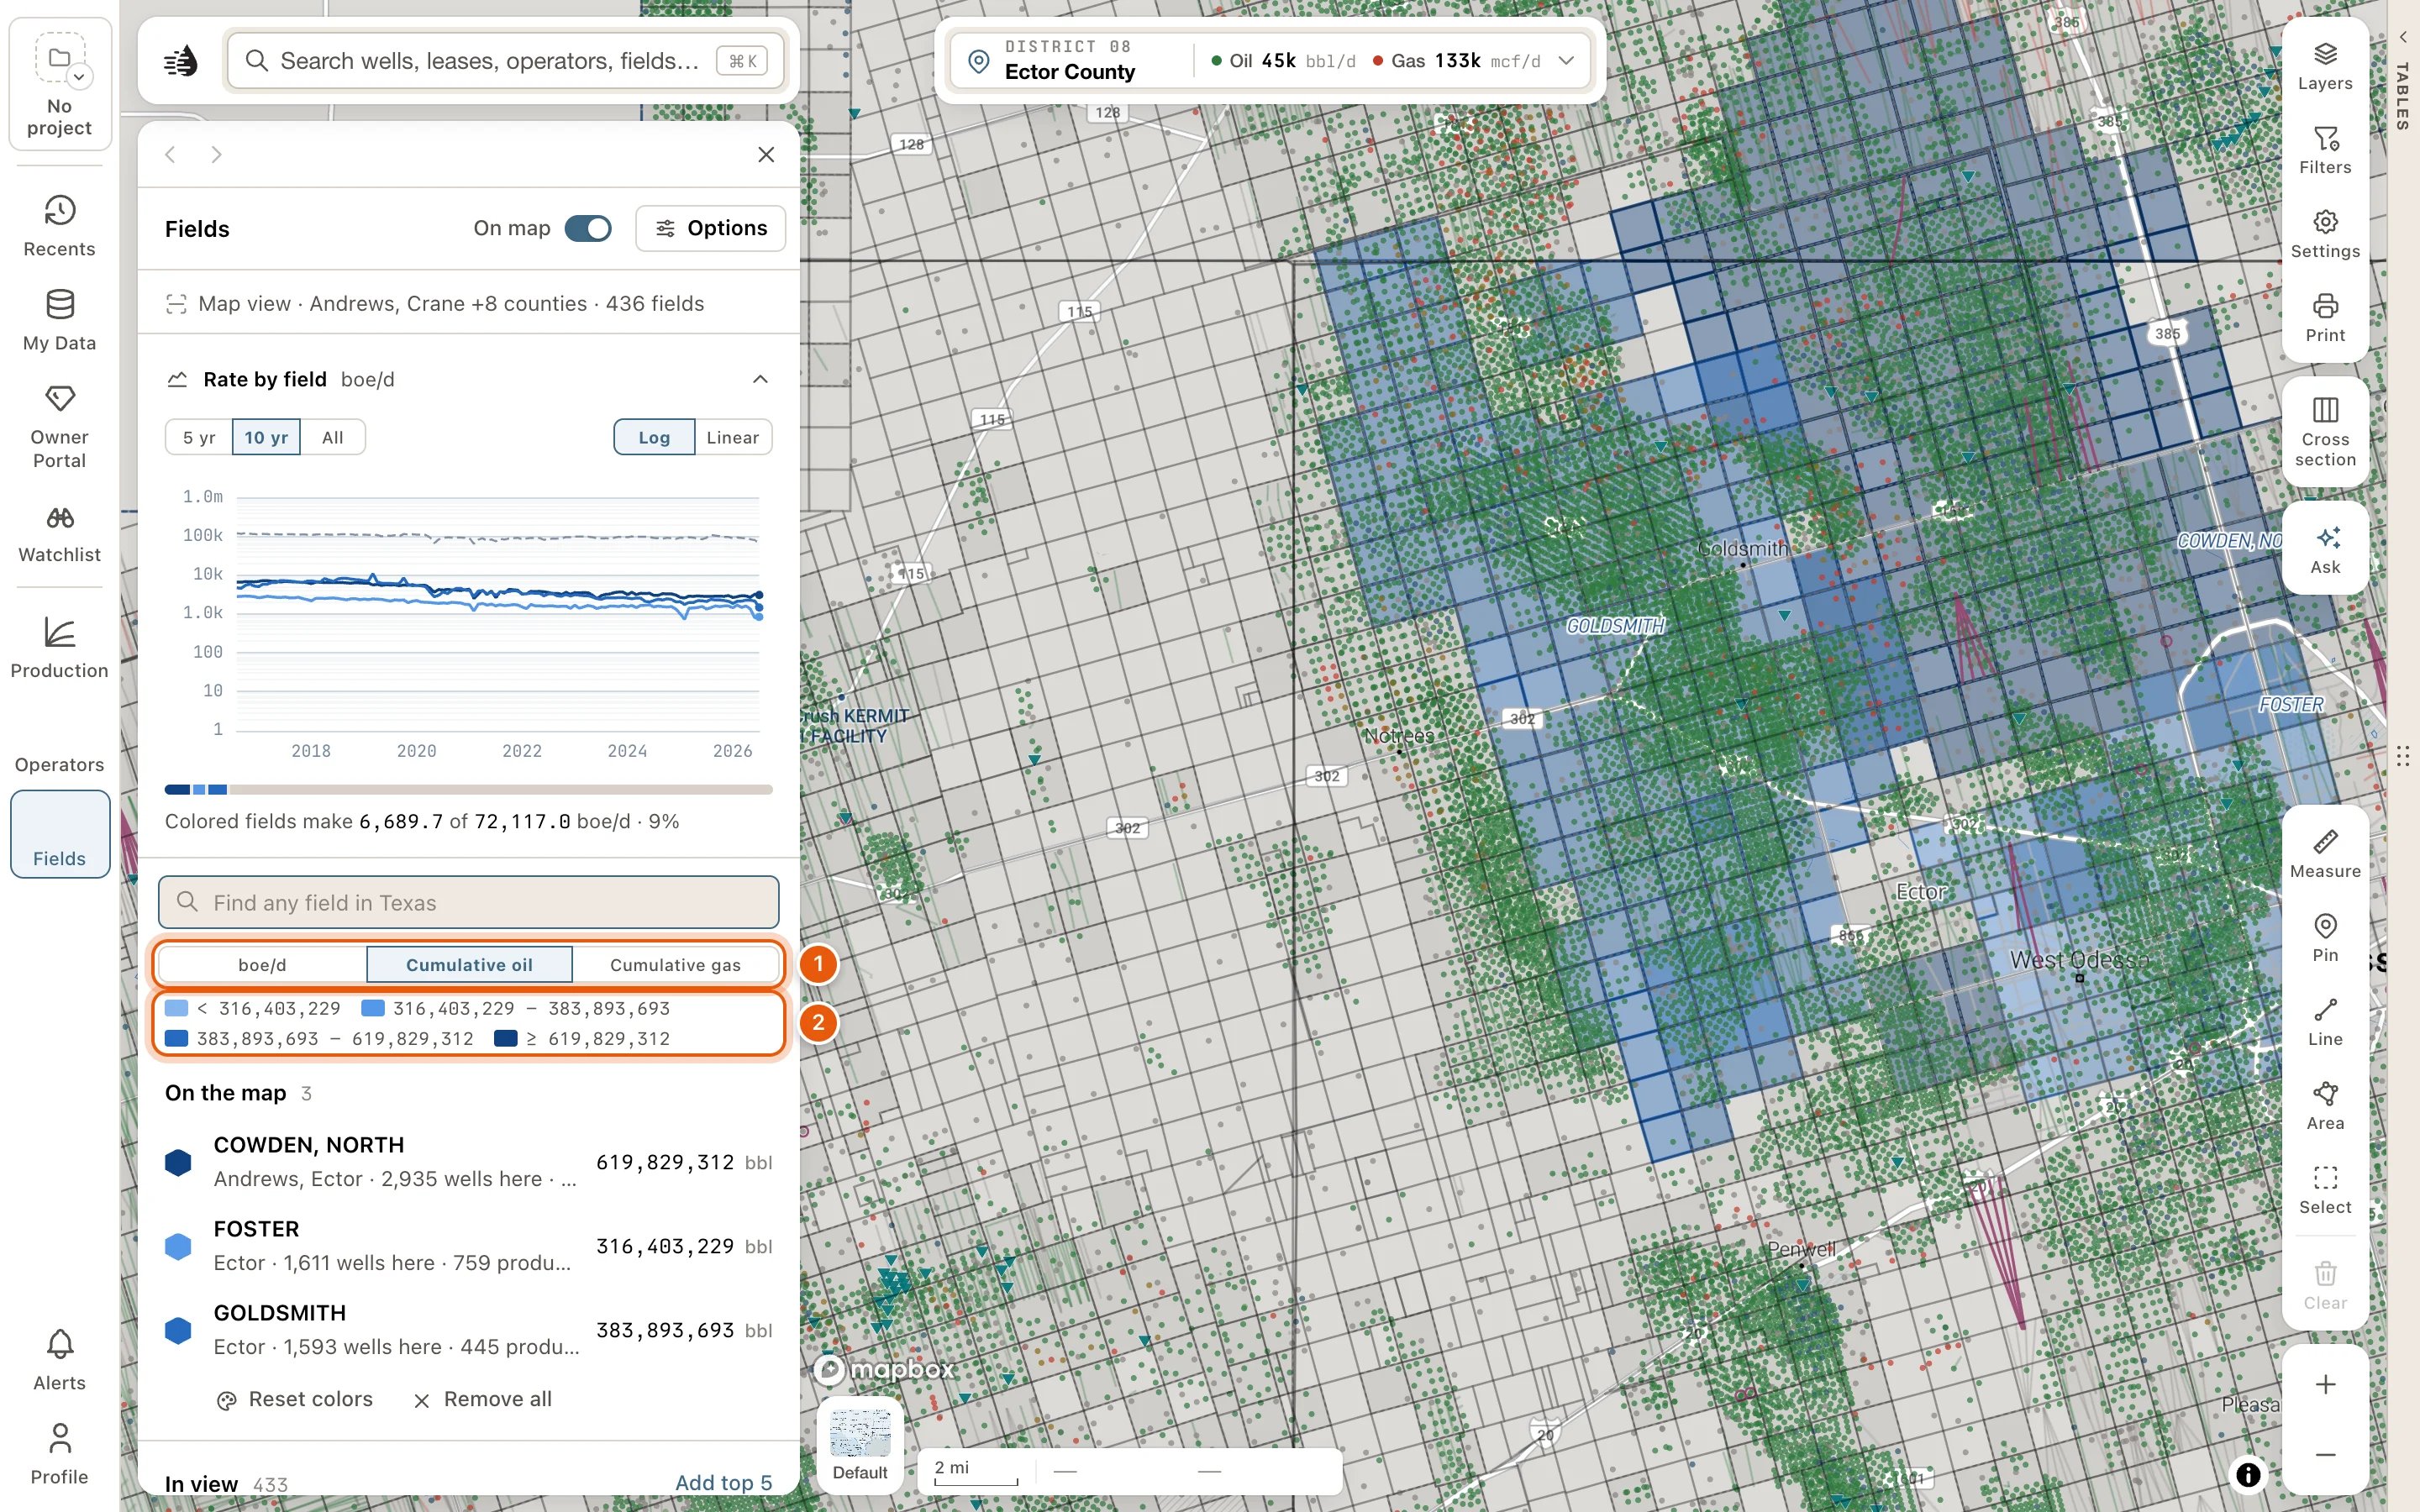
The Fields panel works the same way, with Find any field in Texas and Rate by field. The differences:- A field is in view by its wells. Each row says how many of its wells are here and how many produce. Under On the map, a row also counts the field’s live leases.
- Choose what colors and ranks the fields with boe/d (today’s rate, the default), Cumulative oil or Cumulative gas (the RRC’s lifetime totals for the field). Under Cumulative oil or Cumulative gas, your fields are shaded by that total, with a key, instead of in colors you pick. No RRC figure means the RRC’s field file has no total for that field.
- Other fields in gray starts off. Turn it on under Options to see the other fields in view as gray outlines.
- Allocated well bubbles, under Options, draws your fields’ wells as bubbles sized by the production allocated to each well. It’s an estimate, unless the lease has one well.