

Compare works with a free account. You need to be signed in to see the comparison.
Compare wells side by side
1
Add the first well
Open a well’s card and click Compare. The button is now pressed, and the compare tray appears at the foot of the map with the well in it.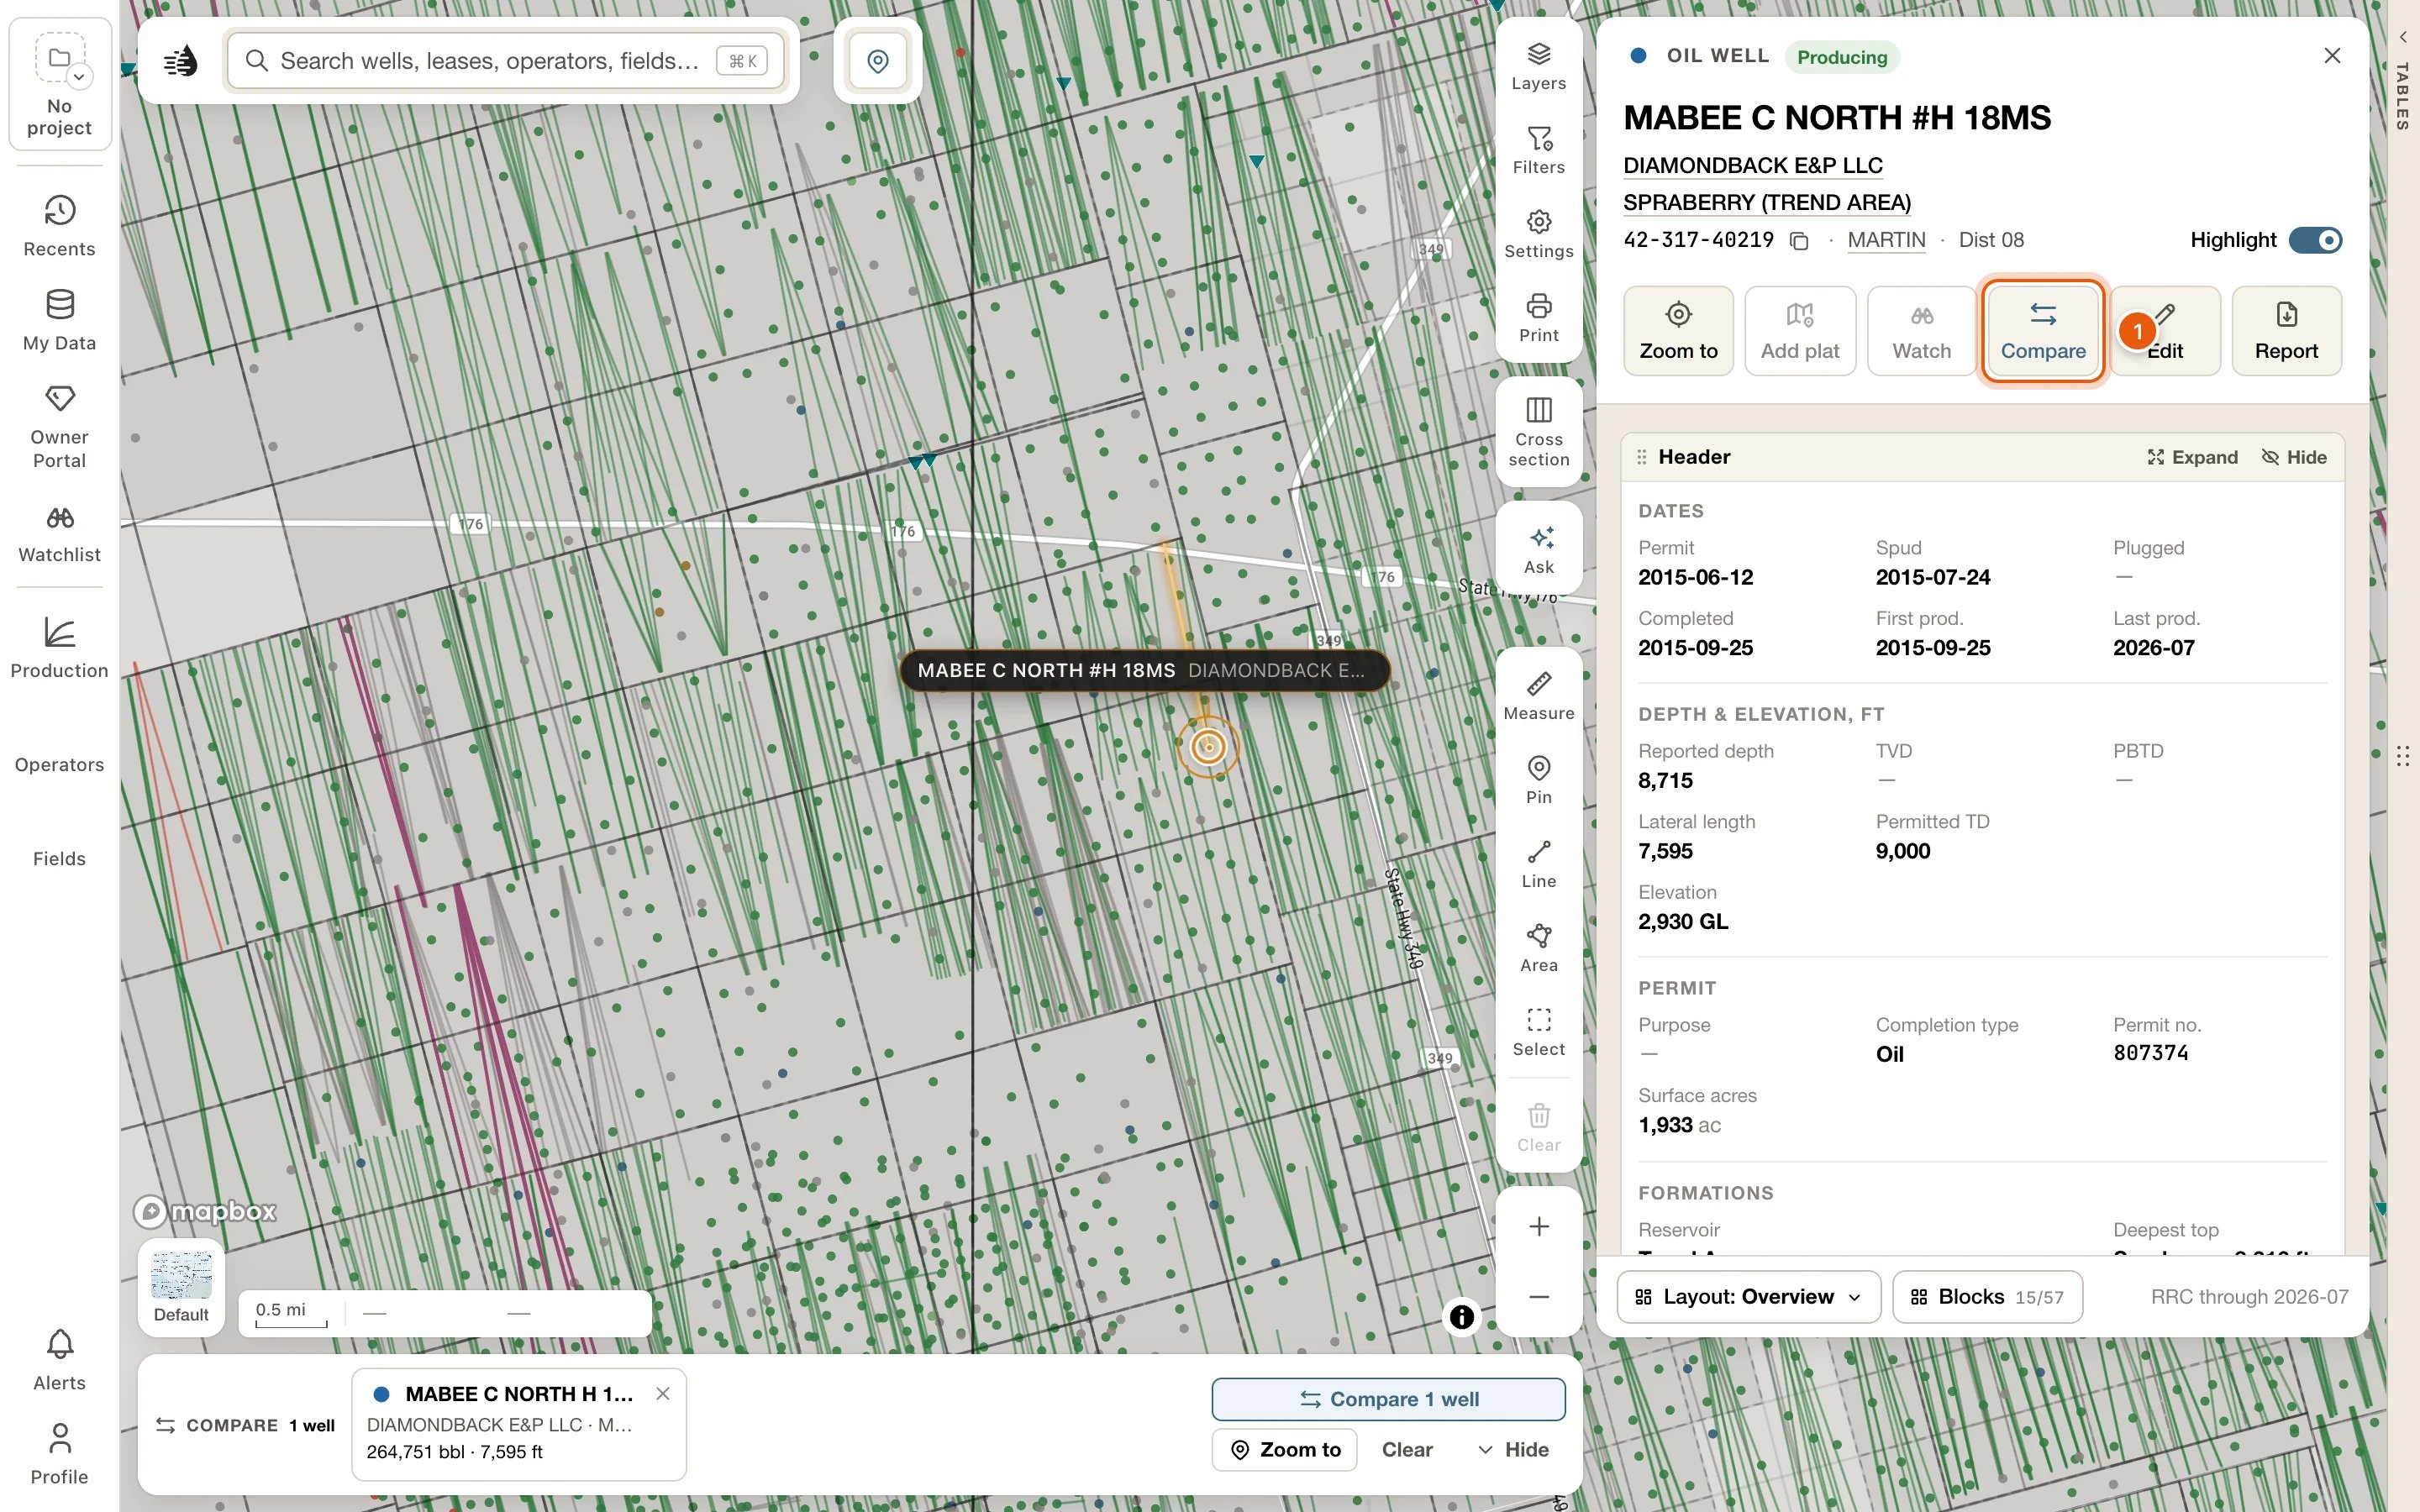
2
Add the wells to set beside it
Click another well on the map and click Compare in its popup, or open its card and click Compare there. Each well joins the tray, in the order you add them.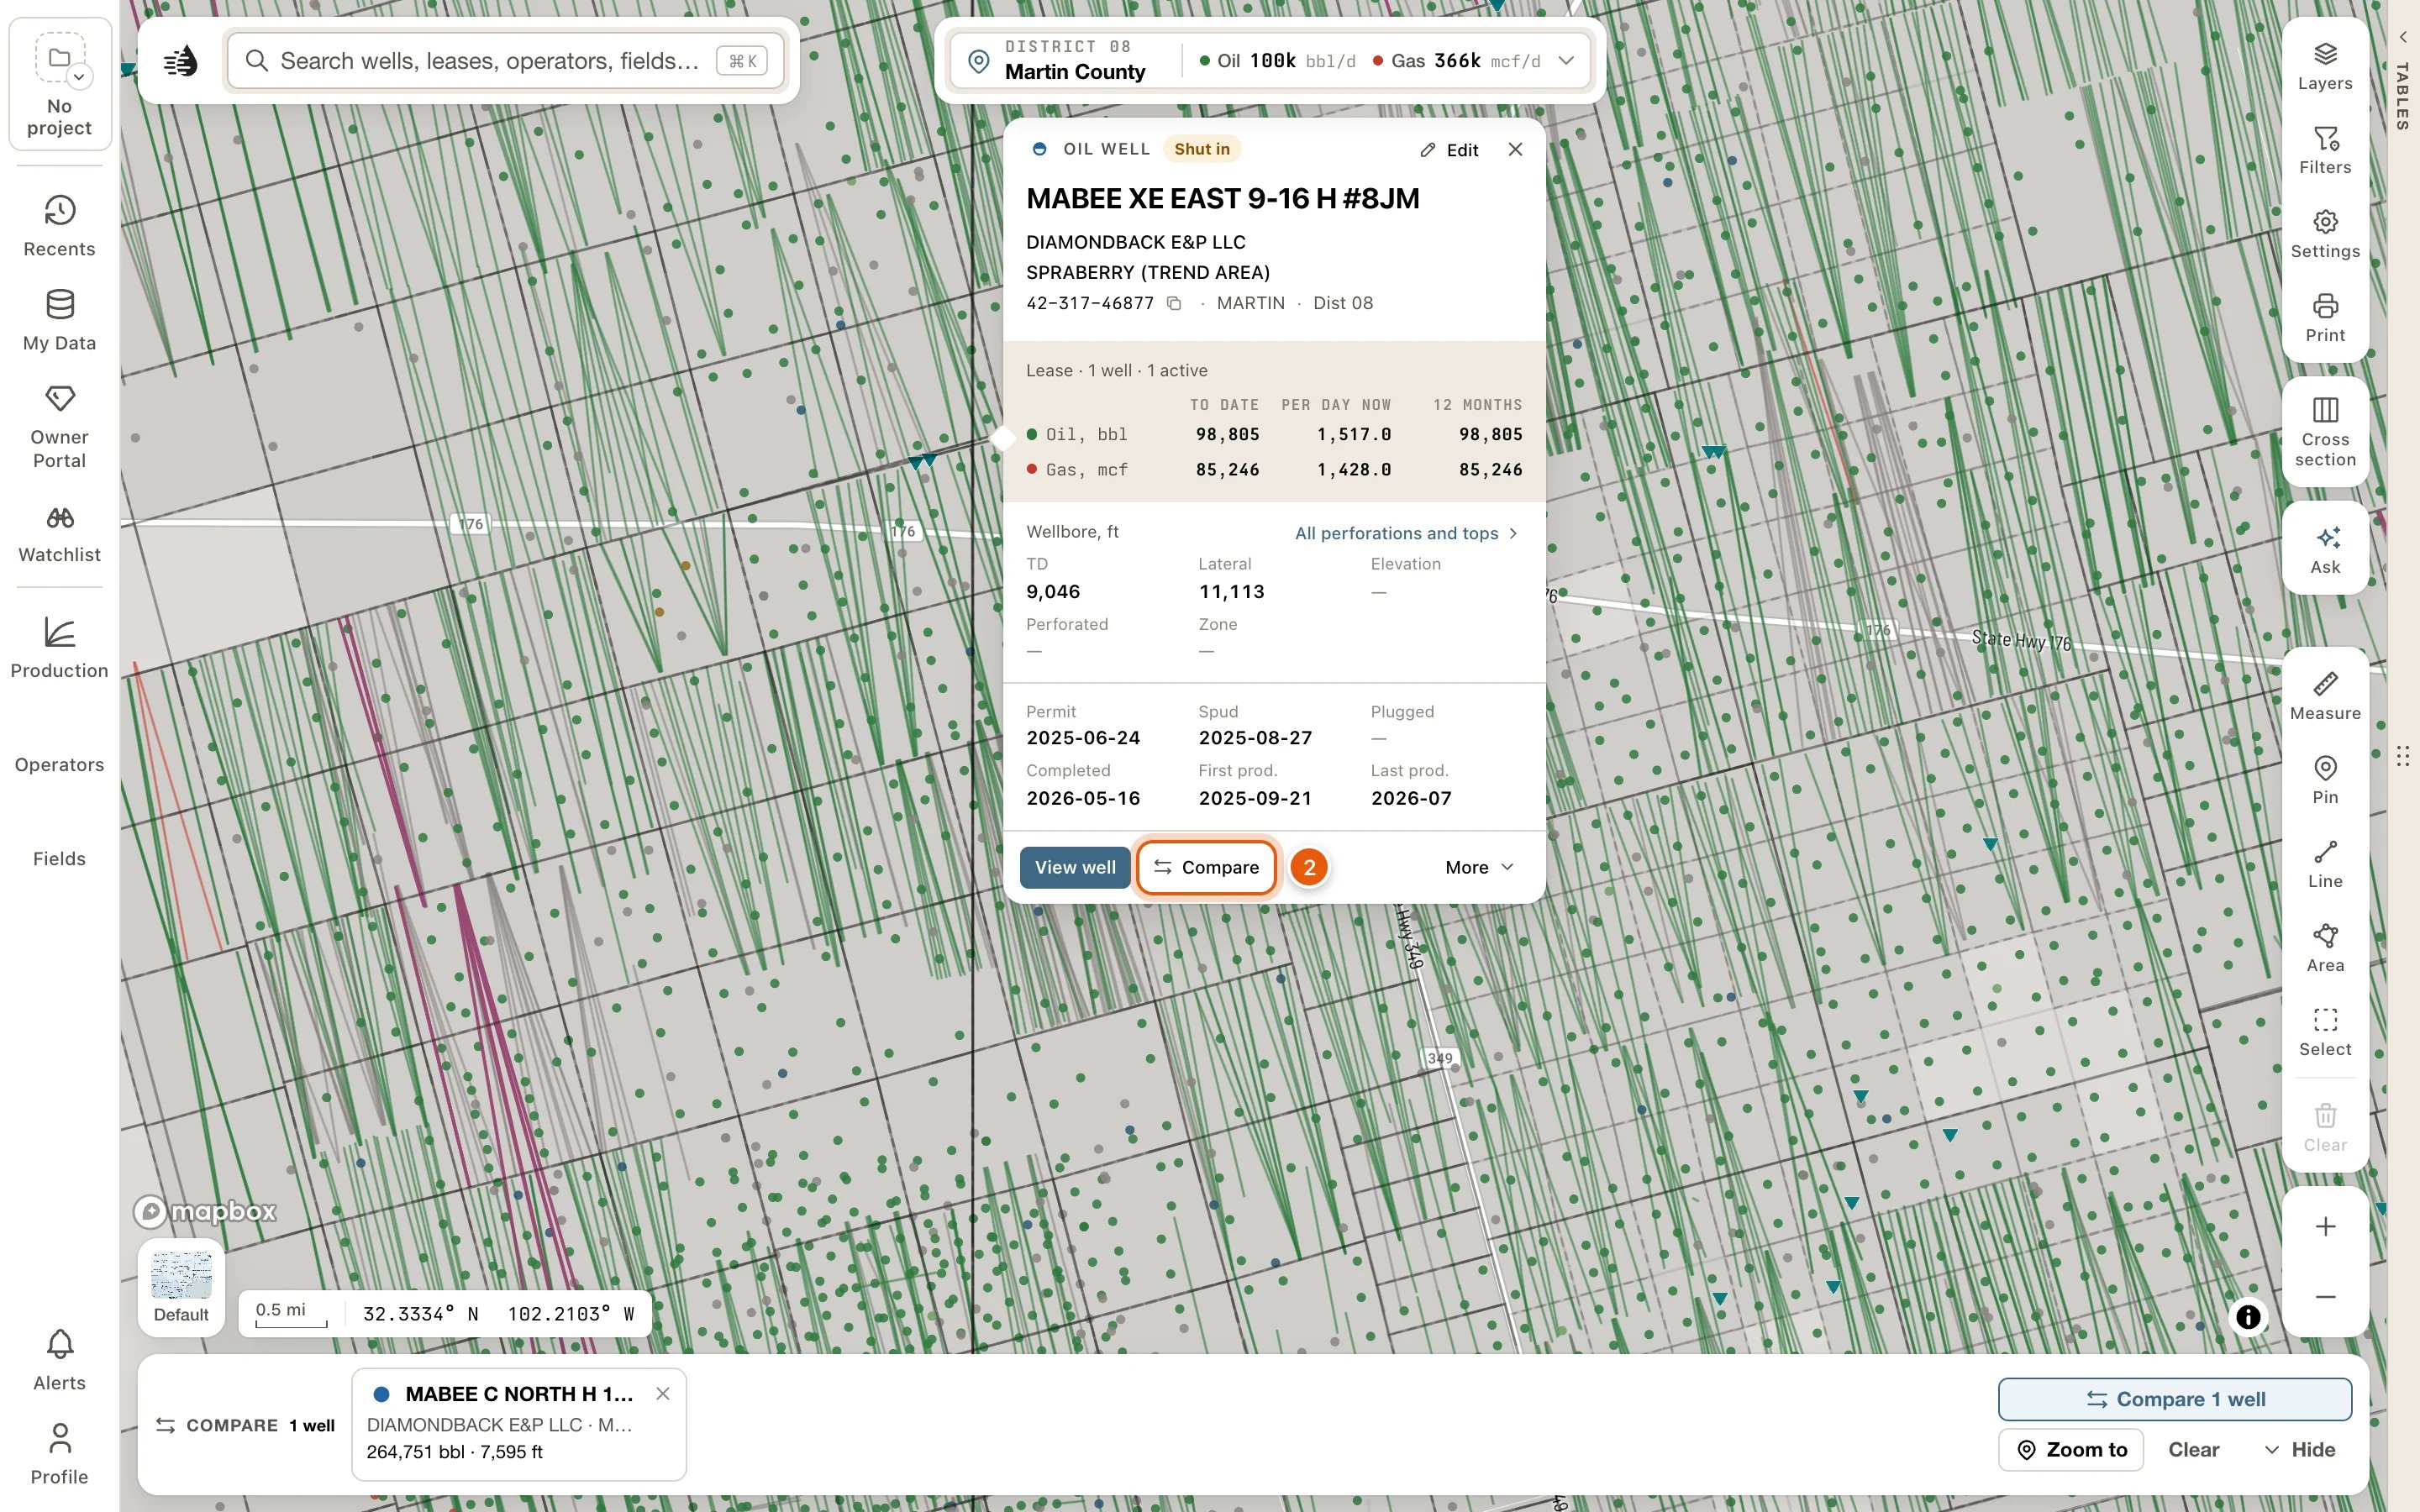
3
Open the comparison
Click Compare N wells on the tray, such as Compare 3 wells. The Compare tab opens beside the map, and the data tables open with it if they were shut.
4
Read the comparison
The Production chart draws the wells on one plot, each from its first producing month. The line under the controls says what’s drawn. Under the chart, the facts grid puts each well in a column, with every figure’s difference from the first well.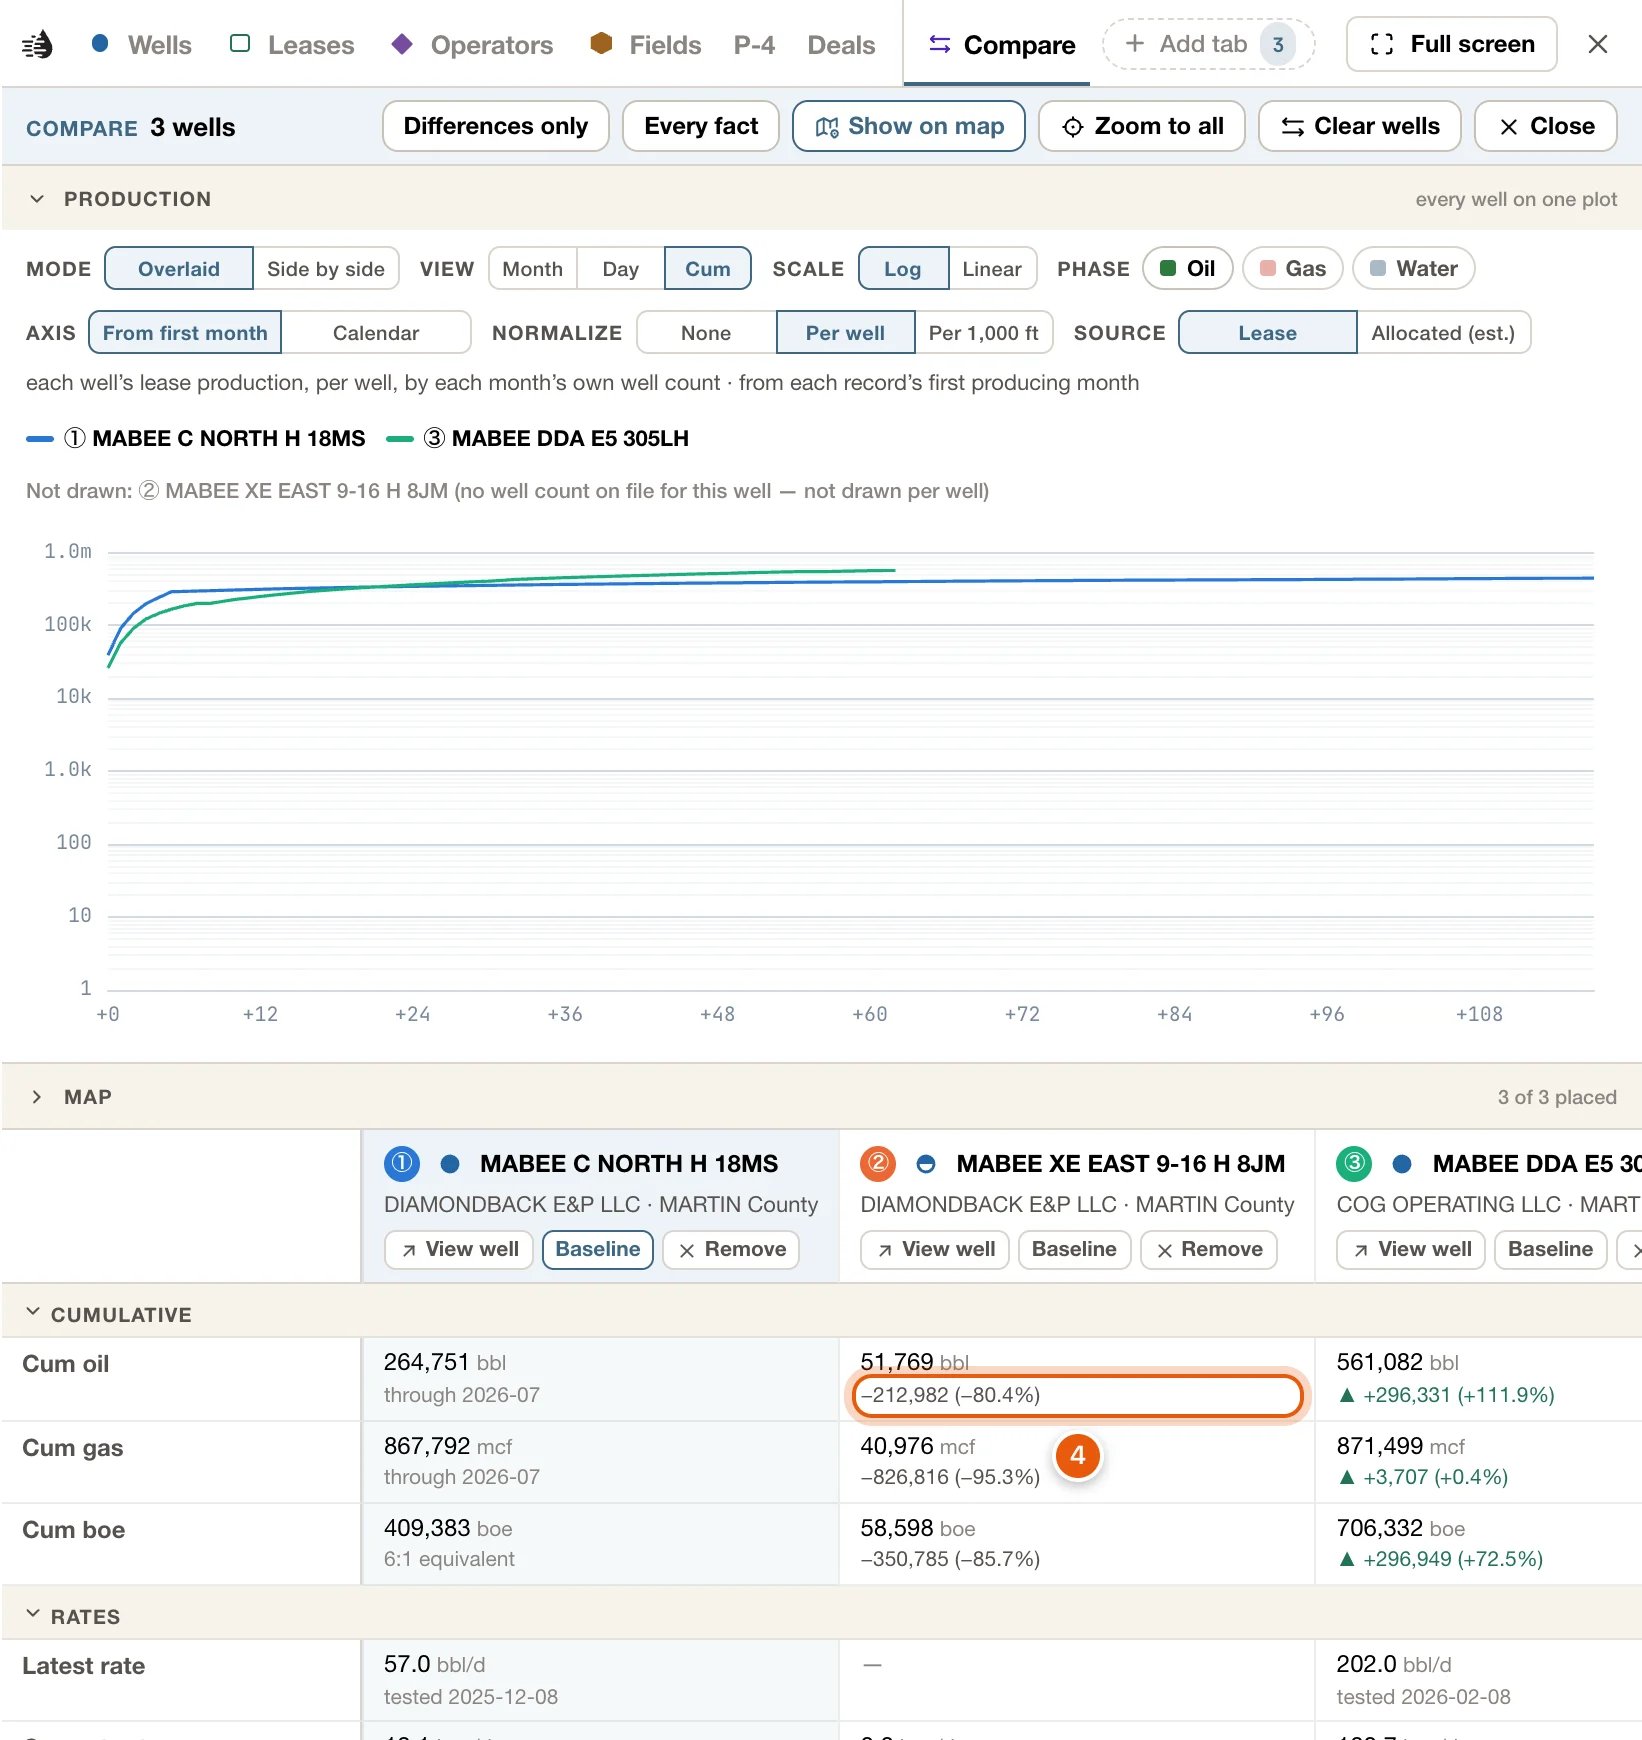
Ways to add a record
To take a record out, click the same button again (Compare, or Remove from compare in the search panel), or the record’s × on the tray.
The compare tray
The tray appears at the foot of the map with the first record you add, and goes when you take the last one out. Opening and closing cards, drawers or the tables doesn’t touch it.
- Each record shows its mark, its name as filed, and a line about where it is or who runs it. Under that, a well shows its cumulative oil and lateral, an operator or an area its oil and gas per day, and a lease or field twelve months of oil as small bars.
- Hover a well or a lease to light it on the map. Click any record to open its card. An area opens as the selection on the map, with its card.
- Its × takes a record out.
- Drag a record to move it, or press ⌥ ← / ⌥ → on it. The order is the comparison’s: it sets each record’s column, number and color.
- When the tray holds more than one kind of record, chips such as Wells 3 and Leases 2 choose which kind it shows, and which the Compare tab compares.
- Compare N wells (or leases, fields, operators or areas) opens the Compare tab.
- Zoom to frames the records on the map. It’s the only thing on the tray that moves the map.
- Clear takes everything out of the tray.
- Hide shrinks the tray to a chip, such as Compare tray · 3 wells. Click the chip to bring the tray back.
The Compare tab
Compare N wells, on the tray, opens the tab. While the tray holds records, a Compare tab also sits on the row of table tabs, with how many records it holds. The tab never changes your own tabs or their filters. The band at the top says what’s compared, such as Compare 3 wells, with the kind chips when the tray holds more than one kind. Then:- Differences only hides the facts every record shares. It needs two records or more.
- Every fact shows every fact the cards know. At first, the grid shows the ones that decide between records.
- Show on map, on at first, draws the compared wells or leases on the map, on top of whatever it shows. Click it to leave the map as your own tabs have it. Areas are drawn by their own outline, so it’s greyed out for them.
- Zoom to all frames the records on the map.
- Clear wells (or leases, fields, operators or areas) takes that kind out of the tray.
- Close closes the tab. The tray keeps what’s in it.
Production
At first the chart is Overlaid, Cum, Log, Oil, From first month, Per well, with wells drawn from their Lease. The line under the controls says what’s drawn, for example each well’s lease production, per well, by each month’s own well count · from each record’s first producing month. Your choices last until you reload Maps.
A record that can’t be drawn one way says why. An operator, a field or an area has no lateral total, so it isn’t drawn Per 1,000 ft. An area’s production is its leases’, each counted whole.
Map
Map, below the chart, is closed at first. Open it to see the records as numbered dots on a small map, in their colors. An operator has no one place on the map, so operators have none.The facts grid
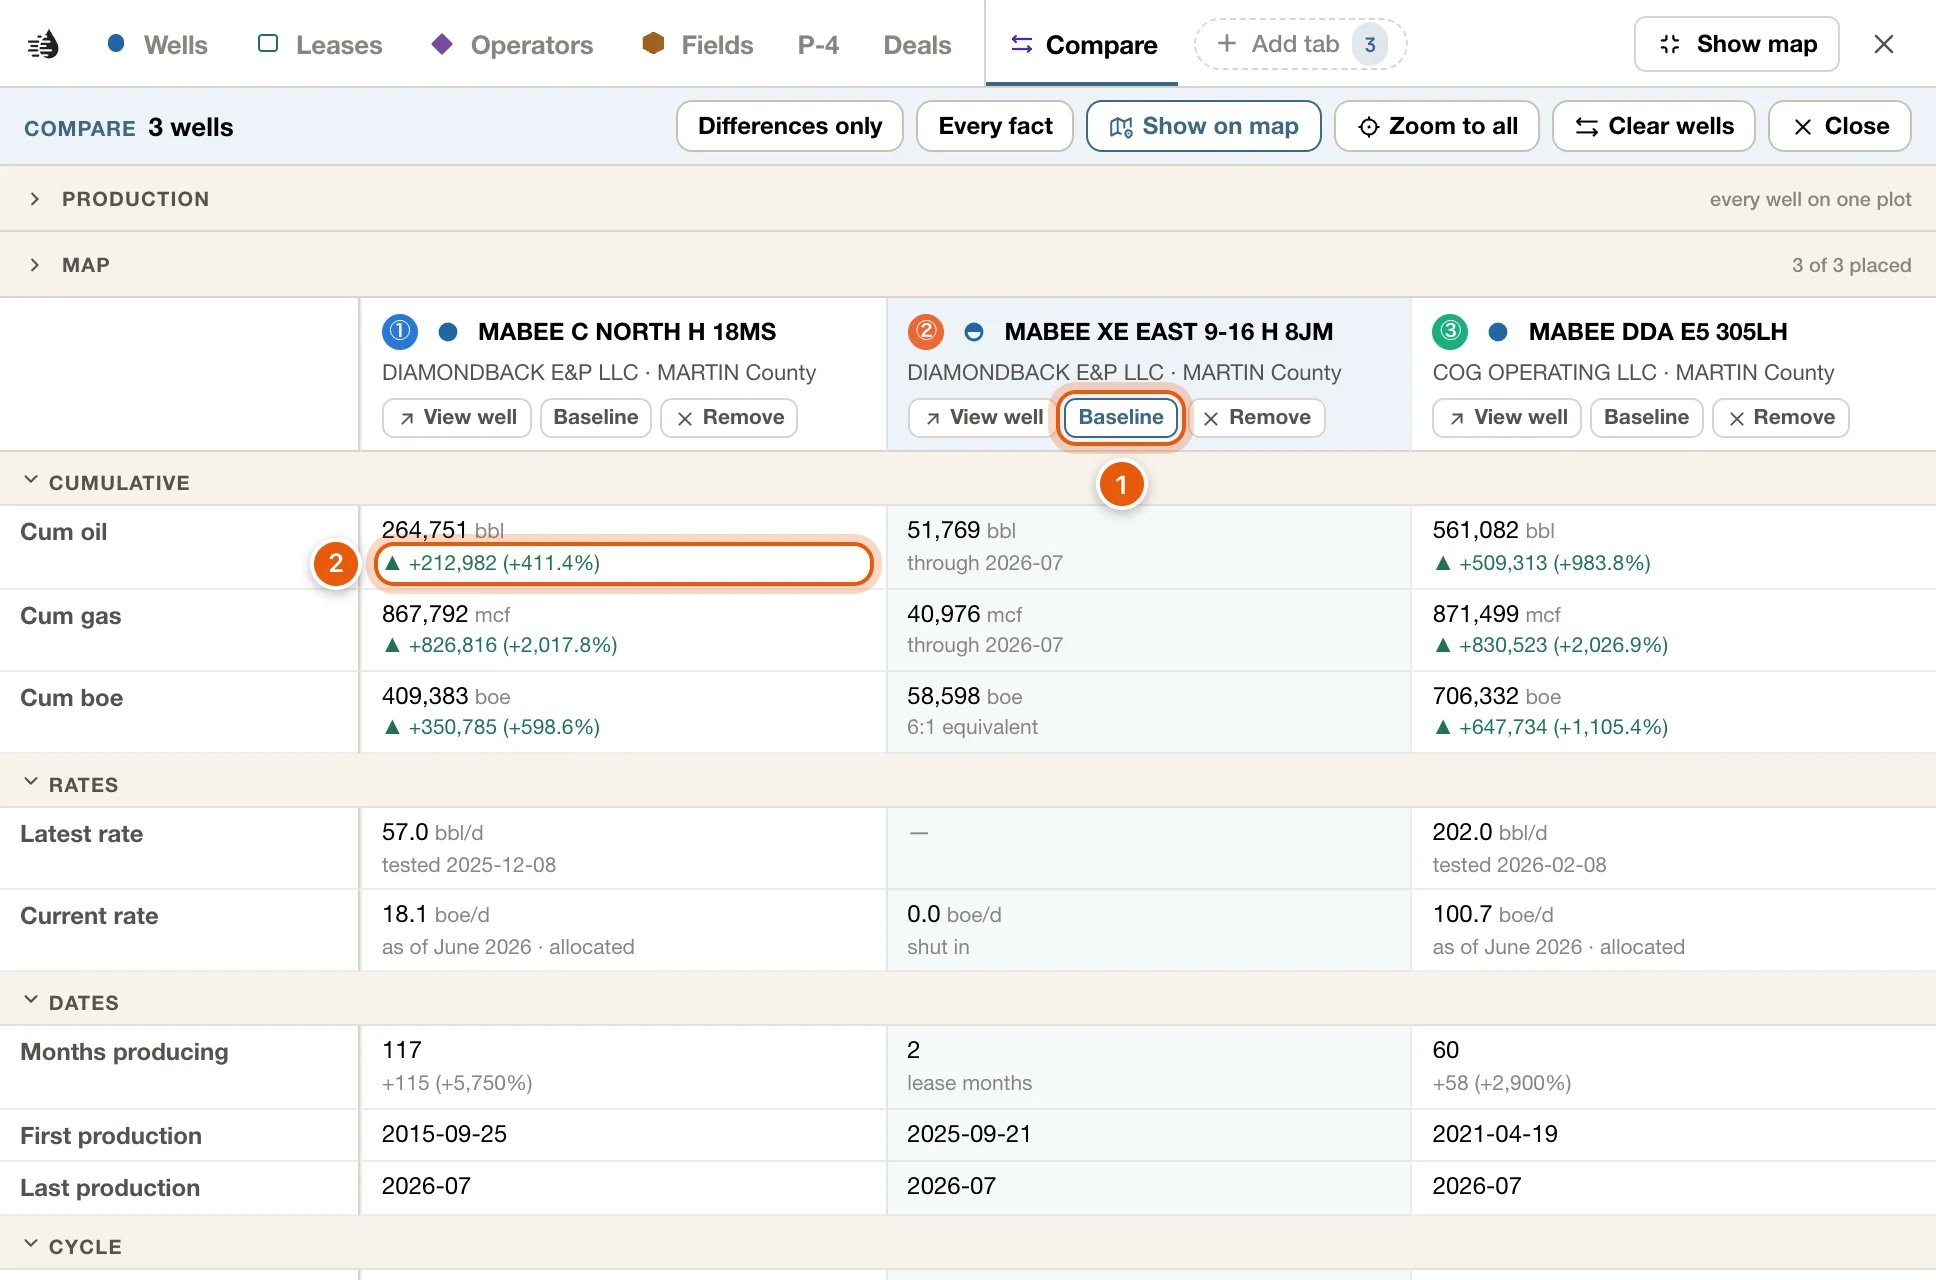
- One column per record, in the tray’s order. Each column head has the record’s number (①, ②…), its mark and its name, and View well (or View lease, View field, View operator or View area), Baseline and Remove. View area makes the area the selection on the map and opens its card.
- Under every figure in the other columns is its difference from the Baseline column, such as +1,234 (+12.5%), or same. The baseline is the first record, unless you click Baseline on another.
- ▲ marks a difference that is better, such as more oil, a higher rate, or fewer days to first production. Depths, dates and shares get a difference without a ▲.
- Facts come in groups. Click a group’s name to fold it.
- A dash means the fact isn’t on file for that record. Hover it to see why.
- To move a column, click its head and press Alt ← / Alt →. The tray follows.
Limits
- Like with like. Wells are compared with wells, leases with leases, areas with areas. The tray can hold several kinds at once; the chips choose which kind you’re comparing.
- Up to 12 of each kind. An add that would go over is refused whole, and nothing is added: That would put 14 wells in the compare tray; it holds at most 12 of one kind. Take some out or pick fewer — nothing was added.
- A record already in the tray isn’t added twice.